On my occasions we would like to place our own objects on top of chart. Graph and Chart has a lot of methods that help you doing just that. This article covers use cases of Converting between chart space and world space , Make sure to take a look because it explains the methods and events used in this article. It is also recommended to have the referenced scenes open when going though this tutorial.
The marker tutorials
Graph and Chart contains two marker tutorials. Both are located in Tutorials/Marker:
- PlaceRect shows how an object can be placed on top of a chart and moved as the chart moves. It also places a point on the last point added to the graph. and also displays the mouse position in graph coordinates.
- TrackerLine shows how a line can be placed on top of a chart. This is useful to track values on the chart. And also can be used as a utility component with your charts.
1. Place Rect
The tutorial scene contains a few objects that are used by the marker script :
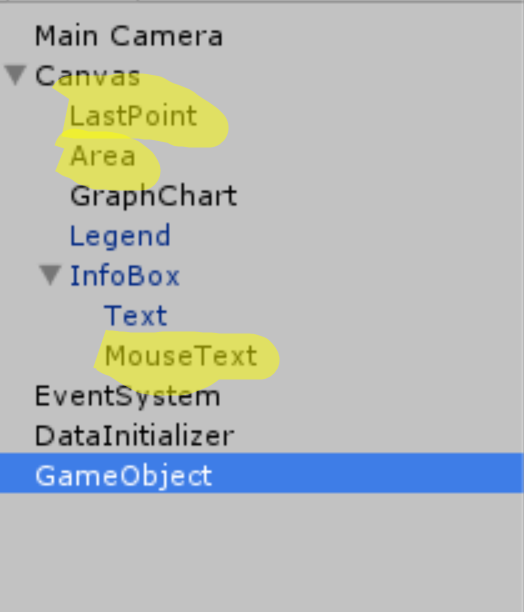
The maker script is placed inside a GameObject in the tutorial scene, these objects are attached to it.
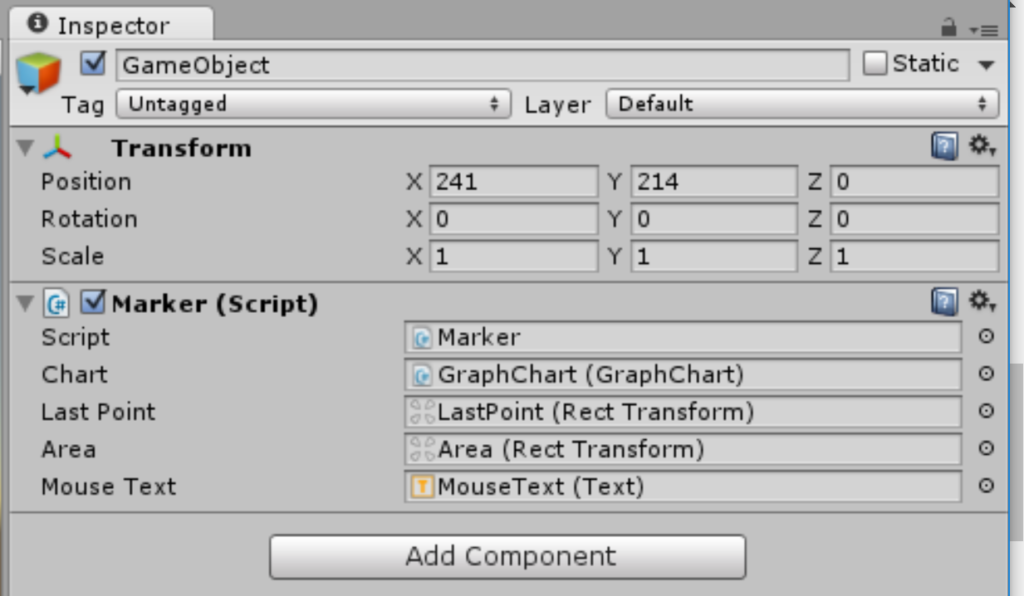
Now let’s see how these objects are changed from the marker script:
// Use this for initialization
    void Start ()
    {
        if (Chart != null)
        {
            Chart.OnRedraw.AddListener(Redraw);
        }
    }
The first step is hooking the OnRedraw event of the chart. the Redraw method will by turn , update all the game objects according to the change in the chart. The OnRedraw event is triggered when the view portion is changed or when new points are added.
The redraw handler in the marker sample places both the LastPoint and Area objects in their proper positions. Let’s see how the point is places:
DoubleVector3 last;
if (Chart.DataSource.GetLastPoint("Player 1", out last))
{
     Vector3 pos;
     if(Chart.PointToWorldSpace(out pos, last.x, last.y, "Player 1"))
     {
           if(LastPoint != null)
           {
                LastPoint.transform.position = pos;
            }
     }
}
Firstly we get the value of the last point appended to the graph. it is stored in last. Then we use PointToWorldSpace to convert the last point in the chart into a world space position. It then applies to the game object Last Point. You can see that it keeps it position on the last point added , no matter how the chart changes.
Now let’s look at the code that places the rectangle on the chart :
        if(Chart.IsRectVisible(currentRect) == false)
        {
            double endX = (float)(Chart.HorizontalScrolling + Chart.DataSource.HorizontalViewSize);
            double x = endX - 1f;
            double y = (float)Chart.VerticalScrolling;
            double endY = (float)Chart.DataSource.GetMaxValue(1, false);
            currentRect = new DoubleRect(x, y, endX - x, endY - y);
        }

        DoubleRect trimRect;
        if (Chart.TrimRect(currentRect, out trimRect))
        {
            Chart.RectToCanvas(Area, trimRect);
        }
In the first part we utilize IsRectVisible to check if the currently created rectangle is in the view of the chart. since the chart is streaming it is bound to be out of view eventually. when it is out of view , we select a new rectangle.
In the second part ,we use TrimRect. The rectangle is trimmed to fit the chart view portion. This way the
rectangle is clipped when it reaches the edges of the chart. Next we use RectToCanvas to apply the trimmed rectangle to the Area gameobject.
Lastly , the marker script also shows a text of the mouse position on the chart. Let’s have a look :
void Update () {
        double mx, my;
        if (MouseText != null)
        {
            if (Chart.MouseToClient(out mx, out my))
            {
                MouseText.text = string.Format("{0:0.00} , {1:0.00}", mx, my);
            }
        }
        else
        {
            MouseText.text = "";
        }

    }
In this part we use the Update method instead of Redraw , the reason is that the mouse can change it’s position even when the chart is not redrawn. This part simply uses MouseToClient to take the mouse position into mx and my. The data is formatted and applied to MouseText.
2. Tracker Line
The tracker line can be used as a learning sample and as a utility with your own charts. first let have a look at how to use it:
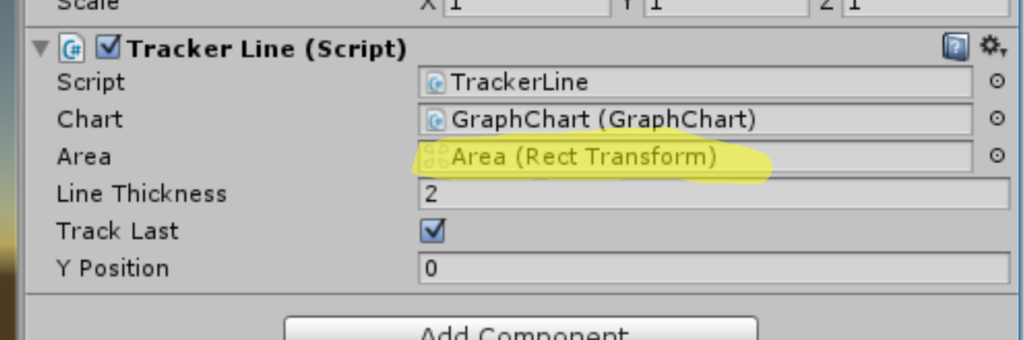
You can apply the tracker line component to any game object and set it up :
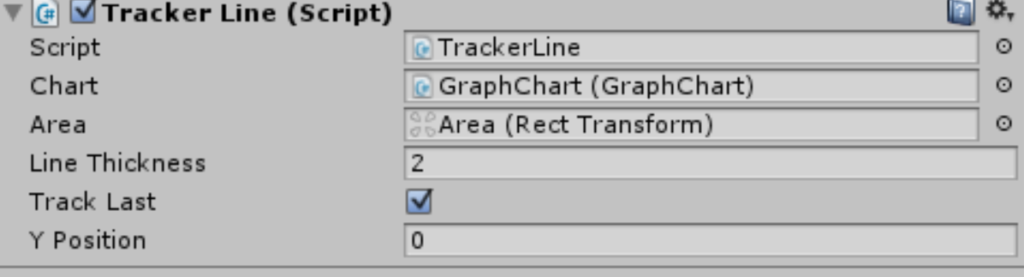
- Chart is the graph chart to which the line is applied
- Area is a rectTransform game object. it will act as the line. It is recommended to use a blank UI Image
- Line Thickness the thickness of the line being set
- Track Last if true , the line is set at the last value added to the graph. Otherwise it is set to yPosition
you can also set yPosition and all other properties from code using GetComponent<TrackerLine>();
Now lets take a look on the implementation of the tracker line tutorial scene . The tracker line contains an object called Area. It is a blank white UI Image .
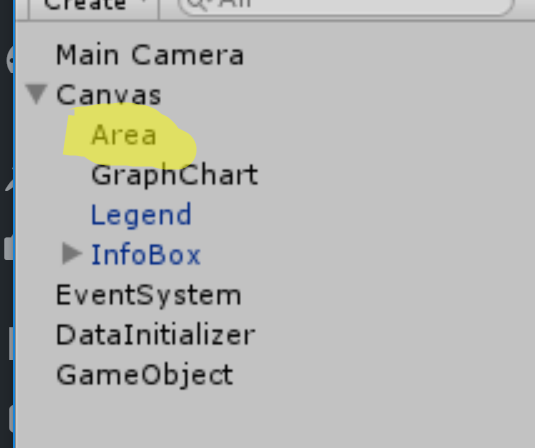
It is placed on the tracker line script , the script will in turn change the positions of the Area object to match the line position:
Now let’s look at how this object is changed in the tracker line code :
    // Use this for initialization
    void Start()
    {
        if (Chart != null)
        {
            Chart.OnRedraw.AddListener(Redraw);
        }
    }
The first step is hooking the OnRedraw event of the chart. the Redraw method will by turn , update all the game objects according to the change in the chart. The OnRedraw event is triggered when the view portion is changed or when new points are added.
Now let’s look at the Redraw method:
DoubleRect rect = new DoubleRect(last.x - Chart.DataSource.HorizontalViewSize, last.y - lineThickness * 0.5f, Chart.DataSource.HorizontalViewSize, lineThickness);

...

if(Chart.PointToWorldSpace(out res,rect.min.x,rect.min.y))
{
                    res.y += lineThickness;
                    double x, y;
                    if(Chart.PointToClient(res,out x,out y))
                    {
                        double thick = Math.Abs(rect.min.y - y);
                        rect = new DoubleRect(last.x - Chart.DataSource.HorizontalViewSize, last.y - thick * 0.5f, Chart.DataSource.HorizontalViewSize, thick);
                    }
}
The first part of the redraw method determines the rectangle that makes the tracker line. Notice that lineThickness is specified with pixel units (world space) , that is why we firstly convert to world space add the thickness and then convert back to client size.
The next step is to position the line on the graph chart:
                if (Chart.TrimRect(rect, out trimRect)) // if the rect is in display
                {
                    if (Area.gameObject.activeSelf == false)    // we draw it
                        Area.gameObject.SetActive(true);
                    Chart.RectToCanvas(Area, trimRect);
             //       Area.sizeDelta = new Vector2(Area.sizeDelta.x, lineThickness);
                }
                else
                {
                    if (Area.gameObject.activeSelf == true) // otherwise it is set as incative
                        Area.gameObject.SetActive(false);
                }
In a very similar way to the previous tutorial , the line rectangle is trimmed and then applied to the Area game object. If the line is out of view , the Area grame object is deactivated.
Hover Text
Hover text is a utility script that is located in Script/Utils. To learn more about hover text check out the hover text article
Now let’s take a look at how the hover text is implemented :
void Start ()
{
    var graph = GetComponent<GraphChart>();

    var labels = GetComponent<ItemLabels>();
    if (labels != null)
        fractionDigits = labels.FractionDigits;
    else
        fractionDigits = 2;

    if (graph != null)
    {
        mChart = graph;
        graph.PointHovered.AddListener(GraphHover);
        graph.NonHovered.AddListener(NonHover);
        return;
    }

    var bar = GetComponent<CanvasBarChart>();
    if (bar != null)
    {
        mChart = bar;
        bar.BarHovered.AddListener(BarHover);
        bar.NonHovered.AddListener(NonHover);
        return;
    }

    HoverStart();
}
In the start method , we check which chart component it attached to the game object. We then add event listeners to it. see Handling click and hover events
The next step is to handle the events:
    void BarHover(BarChart.BarEventArgs args)
    {
        String data = ChartAdancedSettings.Instance.FormatFractionDigits(fractionDigits, args.Value);
        PopText(data, args.TopPosition,true);
    }

    void GraphHover(GraphChartBase.GraphEventArgs args)
    {
        var graph = mChart as GraphChart;
        var point = graph.DataSource.GetPoint(args.Category, args.Index);
        Vector3 position;
        if(graph.PointToWorldSpace(out position, point.x, point.y, args.Category))
            PopText(args.XString + ":" + args.YString, position, true);
        else
            PopText(args.XString + ":" + args.YString, args.Position,false);
    }
we call PopText from both handlers. In the bar chart we use the topPosition provided in the event args , In the graph chart we call PointToWorldSpace so we can know where to place the text.
Pop text then creates a prefab object and positions it in the world space point we obtained. You can replace it with your own method and prefabs to make the most out of hover text.