To grasp the concept of view portion , you can watch the following video , notice how chaining the view portion size changes the size of the graph inside the display
The view portion can be set from both inspector and code. if you will go to the inspector of a graph or a candle chart you will find these settings:
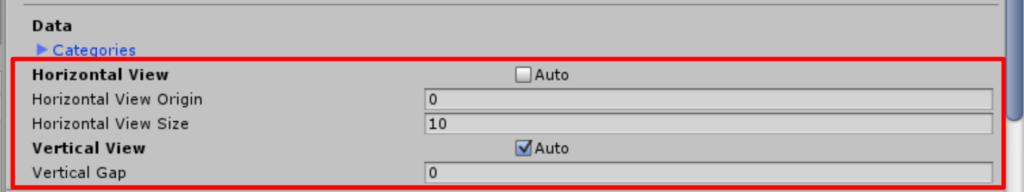
You can use these settings to control the view window of the chart. If you wish the view portion to fit all the data you can check the Auto checkbox.
If you disabled automatic view for an axis. You can set it’s properties:
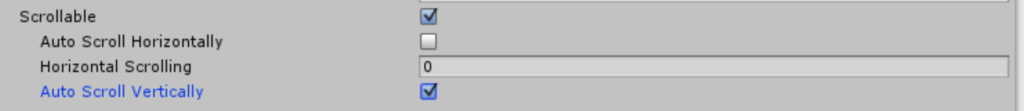
- Scrollable check this in order to clip the parts of the chart that are out of bounds
- Horizontal/Vertical Scrolling sets the amount of scrolling from the axis origin. use this to navigate inside the chart view.
- Auto if this value is true , the other values are ignored and the view is set to fit all the data inside
- Auto Scroll makes it so that the view scrolls to last point that was added to the chart. It makes sense to disable Auto when using this
- View Origin is the beginning of the axis. by default it is 0. If you set it to 1 , this means that the main axis will be place on point 1
- View Size is the size of the view portion. so if the graph start at 0 and you set the view size to 10 , all the points between 0 and 10 are visible
Setting Dates In The View Portion
Sometimes we would like to use dates or time spans instead of numbers. When you need to do so , simply use the time in seconds for that portion. For example : To make a view size of 1 hour , you can set in the value 3600 which is the amount of seconds in an hour.
If you want to set the Scrolling of the chart to 1/1/2019. you can do so by setting it to
1546300800 , This is the unix time stamp of this date.
Setting the view portion in Code
All the setting described in the previous parts of the document can be set using code as well. It can be done like so :
graph.DataSource.AutomaticHorizontalView = false;
graph.DataSource.HorizontalViewOrigin = 0;
graph.DataSource.HorizontalViewSize = 1000;
graph.HorizontalScrolling = 200;
graph.AutoScrollHorizontally = false;
If you wish to use dates and times in order to set the view , it can be done using the utility methods in the class ChartDateUtillity:
graph.DataSource.HorizontalViewSize = ChartDateUtility.TimeSpanToValue(TimeSpan.FromHours(5));
graph.HorizontalScrolling = ChartDateUtility.DateToValue(new DateTime(2019, 1, 1));