As we have learned in Streaming Graph Chart , the graph chart has methods that can animate the insertion of new points. However on some use case we would like to add an entire array of points and have it animate smoothly. This can be done with the utility component Graph Animation. The following article is base on the scene in Themes/2D/Graph/preset2
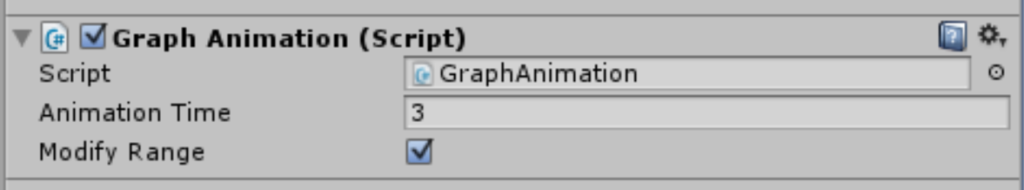
- Animation Time is the total time of the animation
- Modify Range makes the animation component modify the view portion of the chart to match the provided array.
The first step is to add the Graph Animation component to your graph object. The second step is to configure it from script. The script MultipleGraphDemo.cs does just that. Let have a look at how it’s built:
    public GraphChart Graph;
    public GraphAnimation Animation;
It holds a reference to the Graph Chart and to the animation component. This reference is set up from the inspector in the object ‘DataInitializer’:
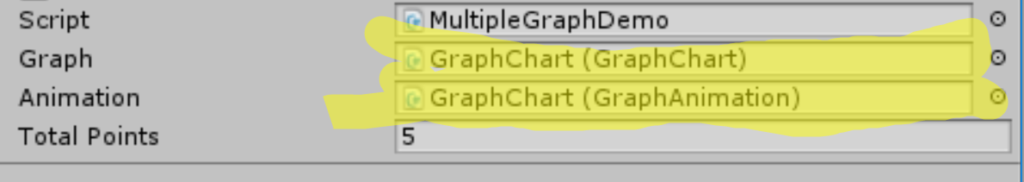
MultipleGraphDemo.cs then uses these references to populate the animation object :
...

        for (int i = 0; i < TotalPoints; i++)  //add random points to the graph
        {

              ...

            animationPoints.Add(new DoubleVector2(ChartDateUtility.DateToValue(System.DateTime.Now + System.TimeSpan.FromDays(x)), Random.value * 10f));
            x += 3;

        }

...

        if (Animation != null)
        {
            if(Graph.DataSource.HasCategory("Player 2"))
                Animation.Animate("Player 2",animationPoints,3f);
        }
As you can see , the script populates an array called animationPoints with the point data. at the end of the method this array is passed into Animation.Animate with the category name and time. This all you need to do to have a smooth line draw animation with the graph chart.