Scroll down for the written tutorial
The resulting scene and script from this tutorial can be found at Assets\Chart and Graph\Demos\Tutorials\Graph
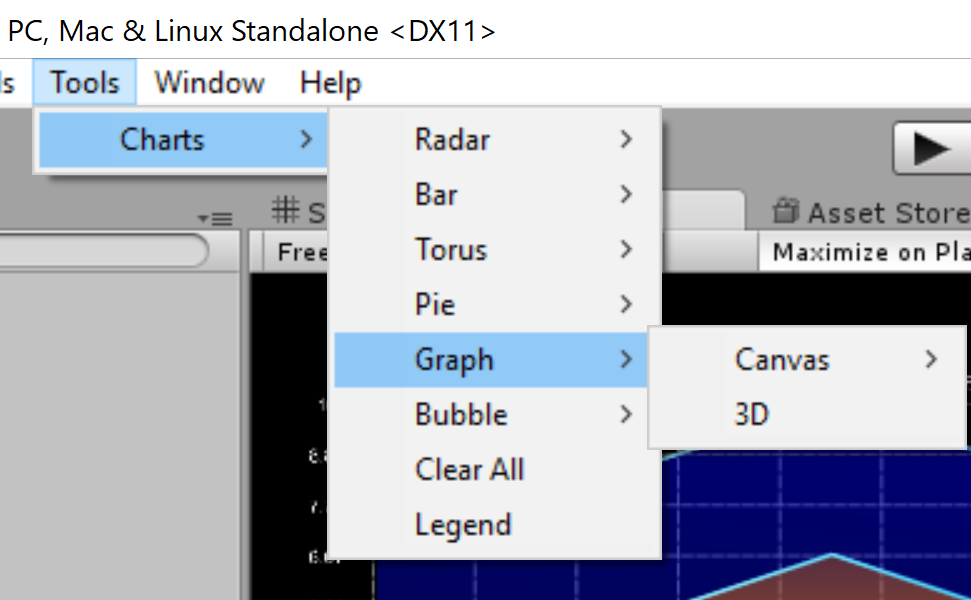
Add a canvas to the scene. Go to Tools->Charts->Graph and select the type of graph you would like to create.
Select the graph object and view it in the inspector. Notice the data section of the chart inspector.
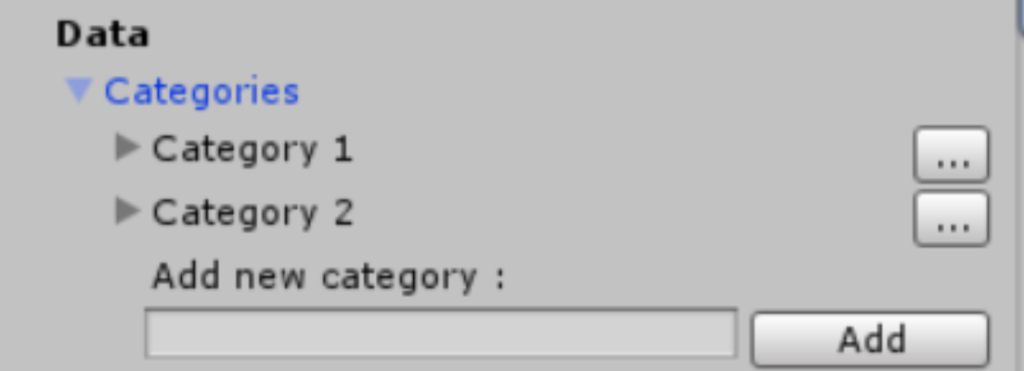
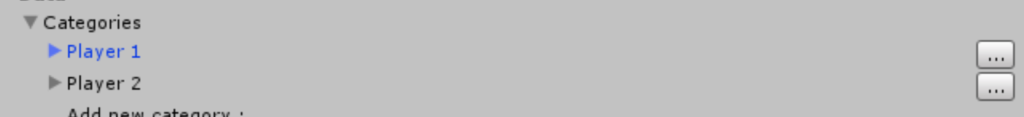
Expand the Categories foldout. You can add categories by typing a name and clicking the add button. You can remove and rename categories by clicking the “…” button near each one. For the sake of demonstration , We will assume that “category *” is renamed to “player *”. After creating the categories the data section should look like this :
Graph data can only be changed through source code. The graph appearance can be customized in the editor. To update the graph chart data from your script , create a new monobehaviour named GraphChartFeed and add the following code to your script :
void Start ()
    {
        GraphChart graph = GetComponent<GraphChart>();
        if (graph != null)
        {
            graph.DataSource.StartBatch();  // start a new update batch
            graph.DataSource.ClearCategory("Player 1");  // clear the categories we have created in the inspector
            graph.DataSource.ClearCategory("Player 2");
            for (int i = 0; i < 30; i++)
            {
//add 30 random points , each with a category and an x,y value
                graph.DataSource.AddPointToCategory("Player 1",Random.value*10f,Random.value*10f);
                graph.DataSource.AddPointToCategory("Player 2", Random.value * 10f, Random.value * 10f);
            }
            graph.DataSource.EndBatch(); // end the update batch . this call will render the graph
        }
    }
NOTICE: calling set value must be done with your own category names. Notice spaces and case letters
Add a GraphFeedChart component to the graph chart object and click play.