Let’s say we have a data set of 250,000 points. While Graph and Chart would be capable of showing some few hundreds of points on screen on a given moment, you can actually create a graph that will allow your users to scroll through the entire data set. You can even add a zoom functionality that will allow you to view entire graph data. This tutorial is based on the Large Data Set example that is located in Tutorial/Large Data Graph
How does the large data sample work
The large data sample uses a page based mechanism to load and unload graph data based on the view portion. This way you can load to the chart only 400-500 points that are currently visible , and save all the memory and performance overhead of the rest of the 100,000 points. Also , if the amount of points in a page is very large , the large data script will down sample the data so that it fits the performance requirements.
How to use the Large DAta Sample
remember to disable automatic view :

Add a large data feed component to your Graph Chart

- Category is the category to which the large data feed loads the data
- Down Sample To Points is the maximum amount of points allowed on screen at a given moment. If there are more points they will be down sampled to fit this value. You can set this to 0 to disable down sampling
If you have initial data that is to be set when the graph loads , replace the contents of SetInitialData in LargeDataFeed.cs with your own loading logic. otherwise you can empty it’s contents.

Notice : The data used with large data feed must be sorted along the x axis.
At any time you want to reset the data of the Large Data Feed , you can obtain it from script and call SetData
List<DoubleVector2> newData = new List<DoubleVector2>();
var dataFeed = graph.GetComponent<LargeDataFeed>();
dataFeed.SetData(newData);
You can also append realtime time data using the following method:
dataFeed.AppendPointRealtime(x,y,animationTime);
// if you wish to a pass a date you can call ChartDateUtillity:
DateTime myDate;
dataFeed.AppendPointRealtime(ChartDateUtillity.DateToValue(myDate),y,animationTime);
The internals of The Large Data Sample
You can use the large data sample without ever needing to understand it’s internals. however If you wish to understand more about how the sample is built , you can proceed to read the following section. It will help you better understand how to create similar implementations using graph and chart.
The concept if very basic when you come to think about it. We have the update method that checks if the chart is out of the boundaries of the currently set page.

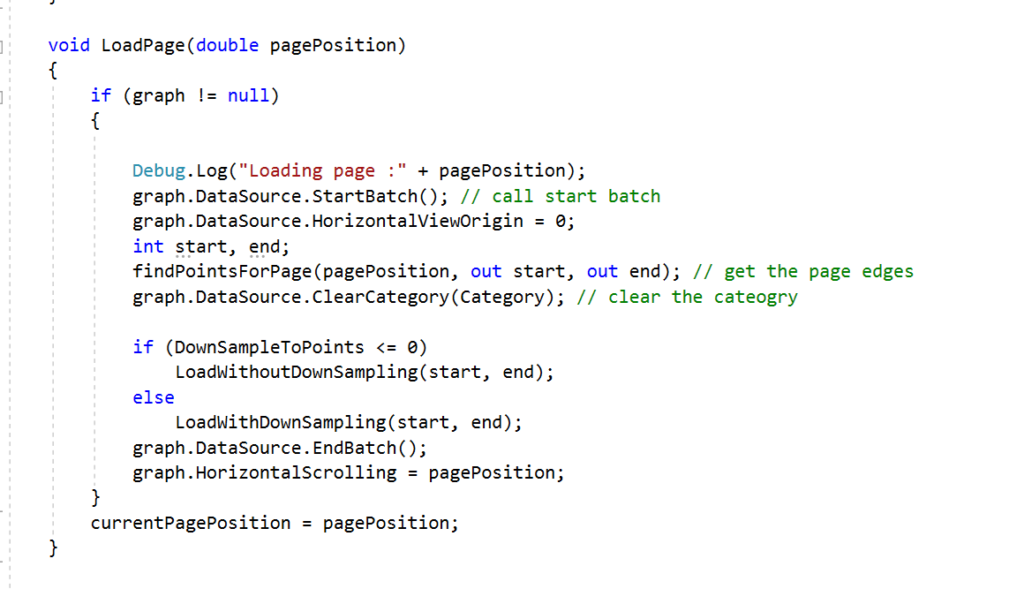
If we are out of the currently set page, LoadPage is called:

It will clear and populate the chart with only needed data. In a similar way to the Graph Tutorial
Load Page obtains the stand and end points in the current window using findPointsPerPage , which takes advantage of binary search to quickly find the start and end points of the page.

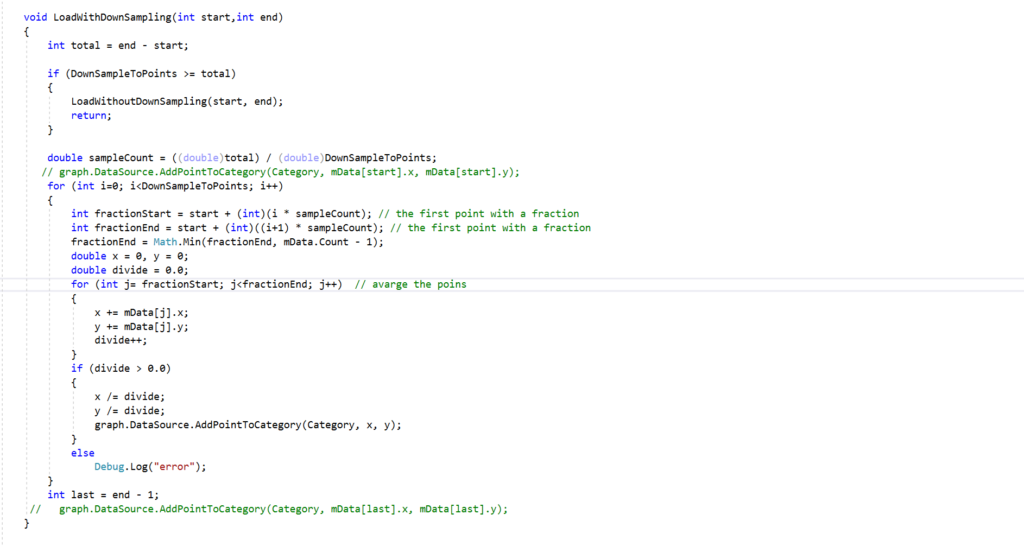
finally if the total amount of points is too high , the data is down sampled by averaging a set of points into one point:
