The graph chart can draw lines as well as curves. The curves are made of curve segments that are made of two points and two control points. This article describes the curve methods of graph and chart. For an example of a curve script , see the Tutorials/Graph folder in Graph and Chart.
Marking categories as curves/Lines
Categories are made of line segments by default. If you wish to use curves , you have to change a category to a curve category first. This can be done from the inspector in the following way :

- Is Bezier Curve marks the category as a curve line , otherwise it is a simple line
- Segments Per Curve is the amount of line segments that make a curve. The higher the number , the smoother the curve. The lower the number , the better performance.
You can also mark a category from script:
graph.DataSource.ClearAndMakeBezierCurve("category");
graph.DataSource.ClearAndMakeLinear("category");
appending Data to a curve category
The first point of a curve chart , must be set using the following method:
graph.DataSource.SetCurveInitialPoint("category",x,y);After adding the initial point you can add a curve segment, There are a few types of curve segments.
You can add a linear curve segment (that acts effectively as straight line)
DoubleVector2 toPoint;
graph.DataSource.AddLinearCurveToCategory("category", toPoint); // this will draw a straight line from the last point to 'toPoint'
A complementary method to AddLinearCurveToCategory , would be MakeCurveCategorySmooth. You can start by adding line segments and then smoothing them out, which gives a smooth line effect. For example:
            graph.DataSource.ClearCategory("Player 1");
            graph.DataSource.ClearAndMakeBezierCurve("Player 2");

            for (int i = 0; i <30; i++)
            {
                graph.DataSource.AddPointToCategory("Player 1",Random.value*10f,Random.value*10f + 20f);
                if (i == 0)
                    graph.DataSource.SetCurveInitialPoint("Player 2",0f, Random.value * 10f + 10f);
                else
                    graph.DataSource.AddLinearCurveToCategory("Player 2",
                                                                    new DoubleVector2(i * 10f/30f, Random.value * 10f + 10f));
            }
            graph.DataSource.MakeCurveCategorySmooth("Player 2");
The result is the following curve:
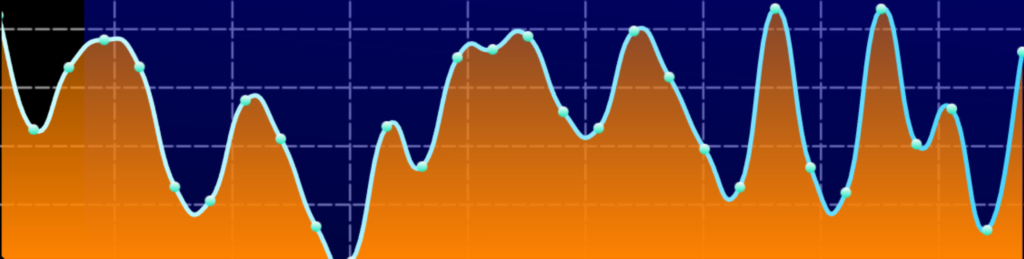
If you want to have full control of the curve control points, you can also add a full curve segment :
DoubleVector2 controlPointA, controlPointB, toPoint;
graph.DataSource.AddCurveToCategory("category", controlPointA, controlPointB, toPoint);
To understand how to use control points , learn about beizer curves