This article is based on an issue encountered by a user who had trouble while importing a very dense data set to the 3D graph chart. In order to make the 3D graph chart look good and solid , we must take 3D smoothing in to account when using it.
What happens when the 3d graph chart is too dense and smoothing is Enabled
If the 3D Graph chart has a lot of data and smoothing is not disabled, we might see some glitches or misalignments in the chart. On extreme cases , it could make the 3D graph chart “collapse inwards”. For example , like in the following image :
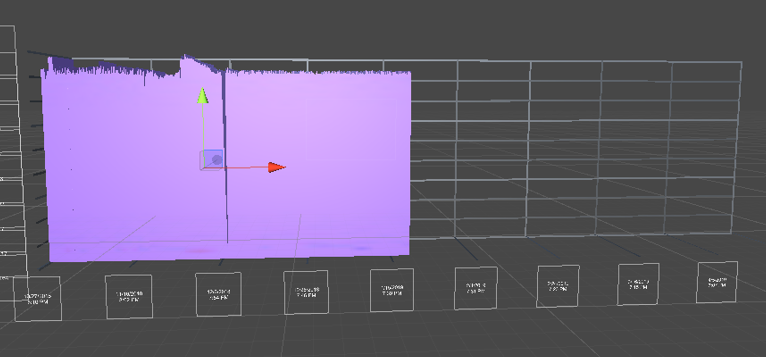
In this case the chart did not fill the entire space it should have filled , because it was smoothed backwards. This issue can be easily addressed though.
disabling chart smoothing
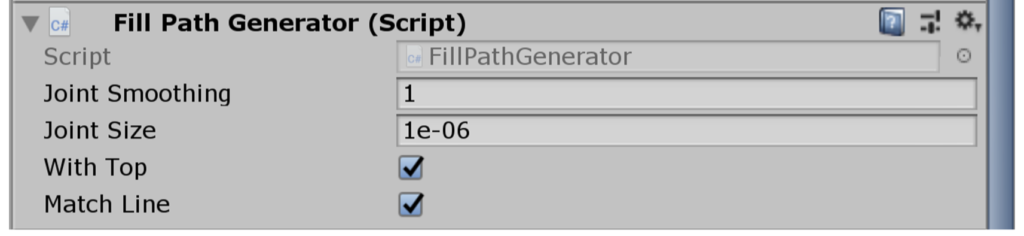
The smoothing of the 3D graph chart is set within the graph prefabs. You can disable smoothing for the prefab by setting it’s smoothing factor to 1 and it joint size to 0.000001
for example to fix the issue in the image above , we can set the fill prefab in the following way :
The same thing can be done to line prefabs as well.
For a more through overview of the prefabs used in graph and chart , take a look at PREFABS