Join Now
  • Home
  • Products
    • Graph And Chart
  • About Us
BitSplash IO

Basic Concepts

⌘K
  • *** VERY IMPORTANT NOTICE ***
  • Tutorial: Quick start
  • Tutorial: Complete chart setup
    • Step 1: Creating a chart GameObject
    • Step 2: Configuring a new category
    • Step 3: Configuring the axis
    • Step 4: Configuring the axis labels
    • Step 5: Filling the chart with Data
    • Step 6: Adding an interaction to the chart
  • Setting the view portion
  • Setting up the categories of the chart
    • Adding a new category
    • Deleting a category
    • Renaming a category
  • Setting up the visual features of a category
    • Adding a new visual feature
    • Reordering visual features
    • Renaming a visual feature
    • Deleting a visual feature
  • Setting up the visual features of the axis
  • Loading data into a category
  • Number formats and date formats
  1. Home
  2. Docs
  3. Basic Concepts
  4. Tutorial: Complete chart ...
  5. Step 2: Configuring a new category

Step 2: Configuring a new category

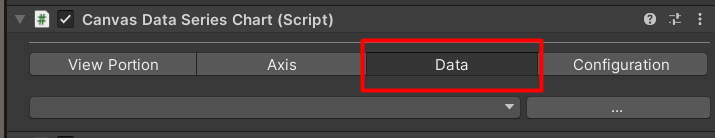
Switch to the ‘Data’ Tab in the chart inspector

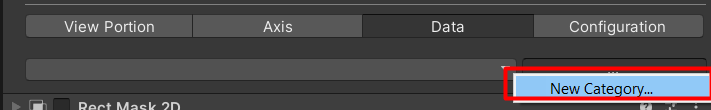
Click the ‘…’ button And SELECT THE ‘NEW CATEGORY’ OPTION

CLICK THE ‘…’ BUTTON AND SELECT THE Rename OPTION

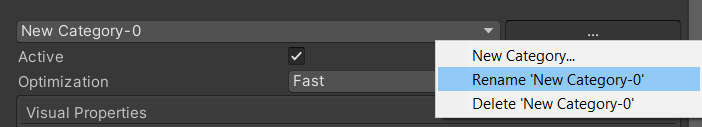
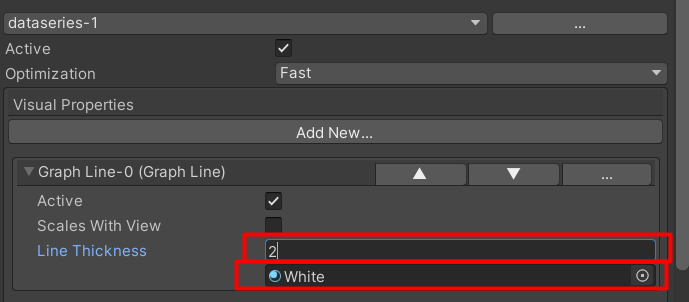
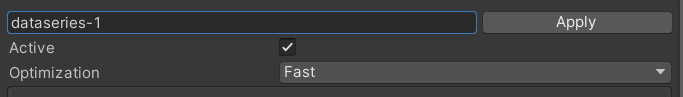
Rename the category to ‘dataseries-1’

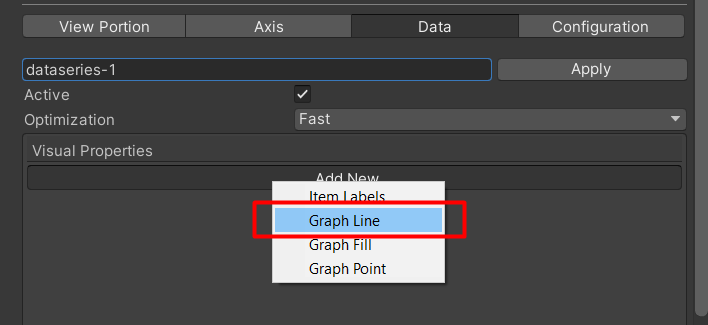
Click ‘Add New’ and select ‘Graph Line’

Assign a material and line thickness to the new Graph line

NOTE: For best performance , use a material with the shader “Chart/Canvas/Solid”


Next Step

Continue to the next step of this tutorial

Doc navigation

← Step 1: Creating a chart GameObjectStep 3: Configuring the axis →
  • Home
  • Support
  • About Us
2019 © Copyrights BitSplash.