All charts in Graph and Chart are divided in a way that allows you to easily control their data. The division of all charts is either to categories or to both categories and groups. The goal of this article is to give you a basic understanding of the concept of categories and groups , you can learn more about their use by learning how to use the different charts of Graph and Chart.
What are Categories
Categories define a part of the chart that can be customized. This can be for example a data series in a graph chart :
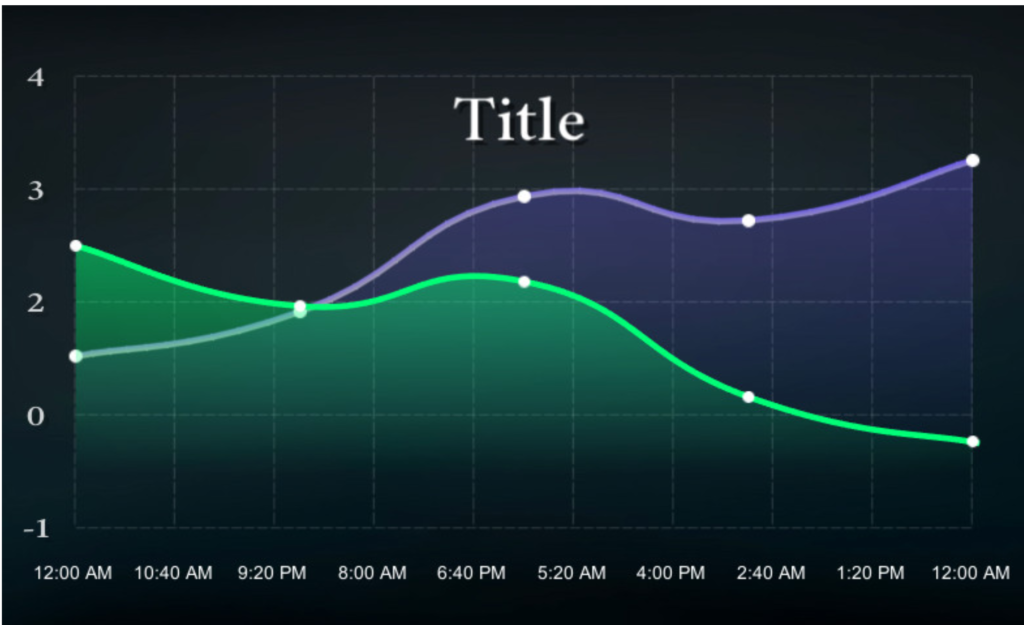
What you can see in the above image is a graph chart with two categories . one is purple and the other is green. Each of these has it’s own data. Here is another example with a bar chart :
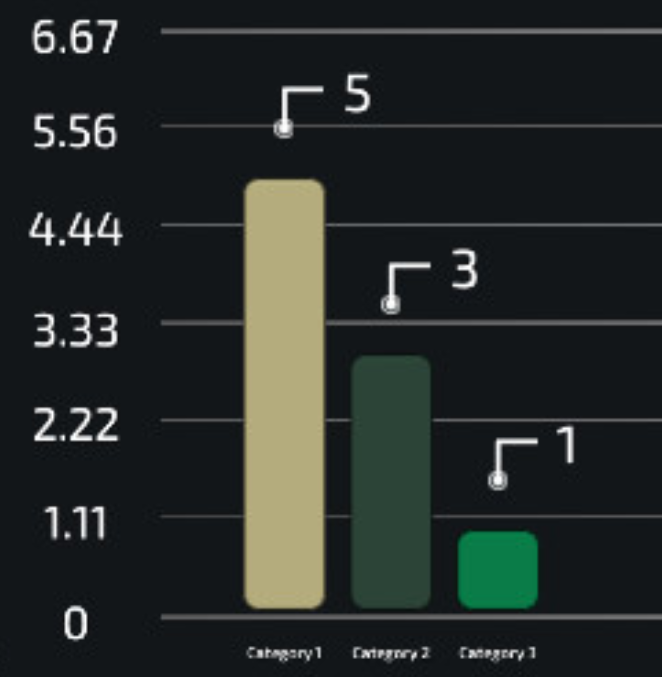
Here there are 3 categories , you can see that each of the bars has it’s own unique visual customization and material.
What are groups
Groups are used in the bar chart and in the radar chart. Their goal is to group a few categories together. if we consider the bar chart example above , we can add 2 more groups and have this chart :
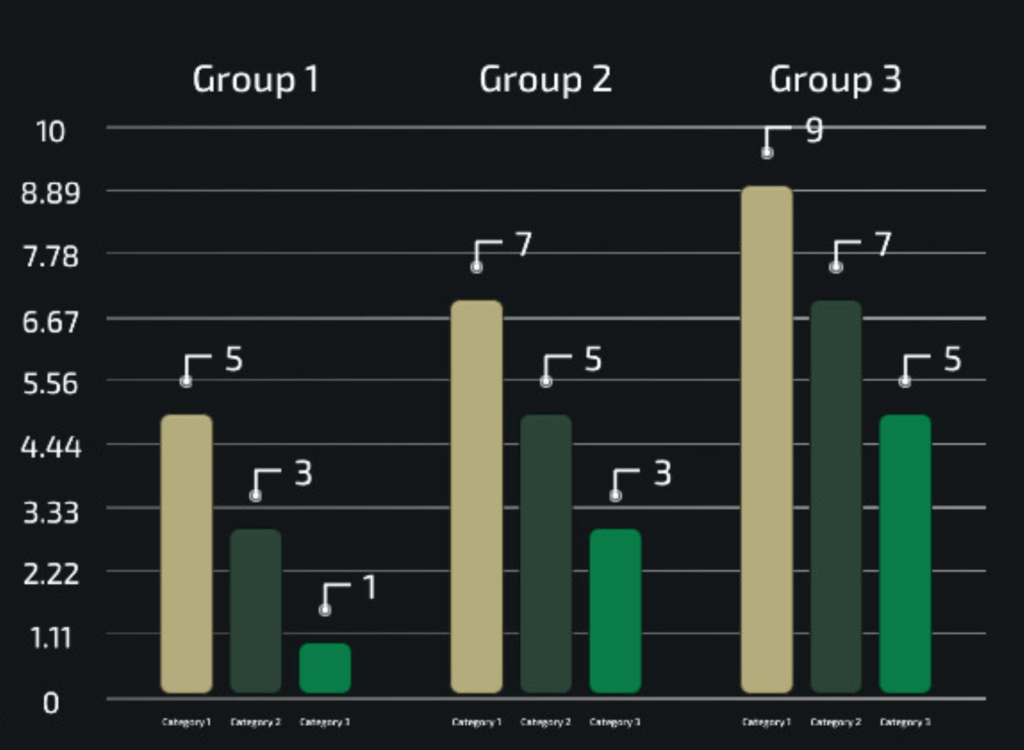
So in here , each new groups adds 3 bars. This allows you to easily add more data and to order it in a way that makes sense
NAMING CATEGORIES AND GROUPS
Each category and each group has a unique name that identifies it within a chart. You can use this name to load data into the category or group from script for example. The names of categories and groups are case sensitive and are sensitive to spaces as well. Also , you cannot have two categories of the same name within a chart , and you cannot have two groups with the same name as well.
Categories and Groups in the inspector window
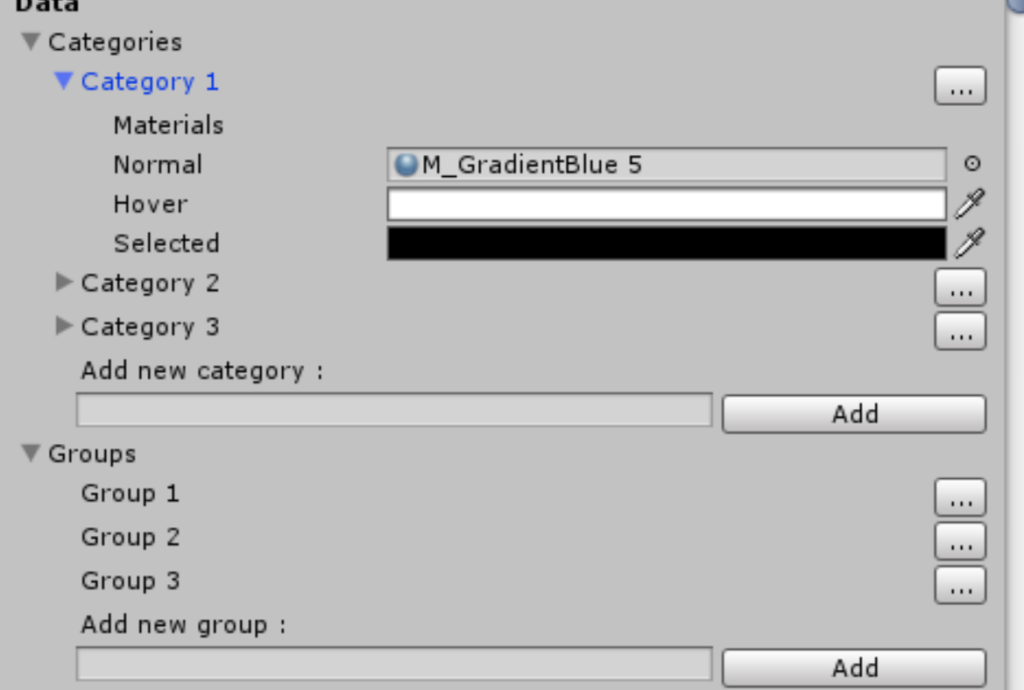
The categories and groups of charts can be set from both script and inspector. To find them in the inspector, go to the chart component and scroll down to the Data section

You can type in a new name and add a category or a group. you can also edit the current categories or groups by click the button to the right of them :

Categories can also be expanded, the settings of categories change according the chart they belong to :
Be sure to check that documentation on each chart to understand how it’s groups and categories are used