The bar chart has a few view types:
Normal view type
A normal bar chart looks like this :
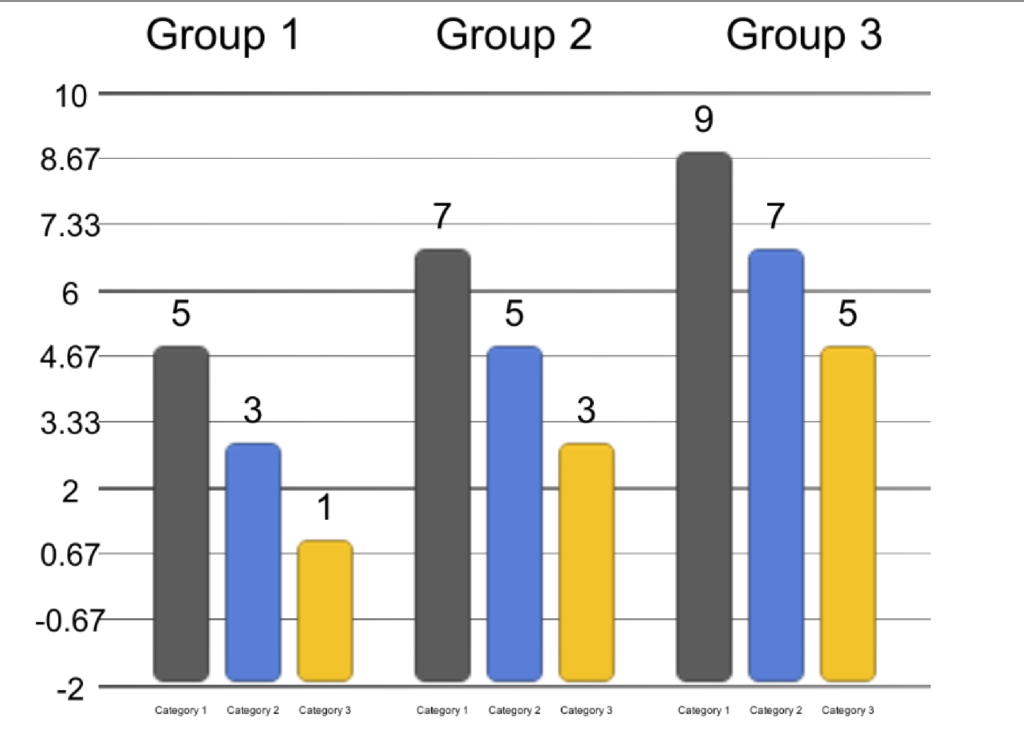
The key features of it are :
- The bars are spread across the chart with equal height
- The chart starts from -2 and ends in 10 . All the bars start at the lowest point , -2.
Negative view Type
The negative view type looks like this :

The key features of it are :
- The bars are spread across the chart with equal height
- All the bars start from 0. Negative bars go downward , Positive bars go upwards
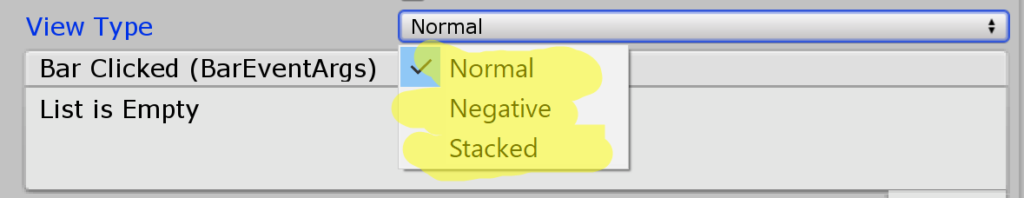
Stacked View Type
The stacked view type looks like this:
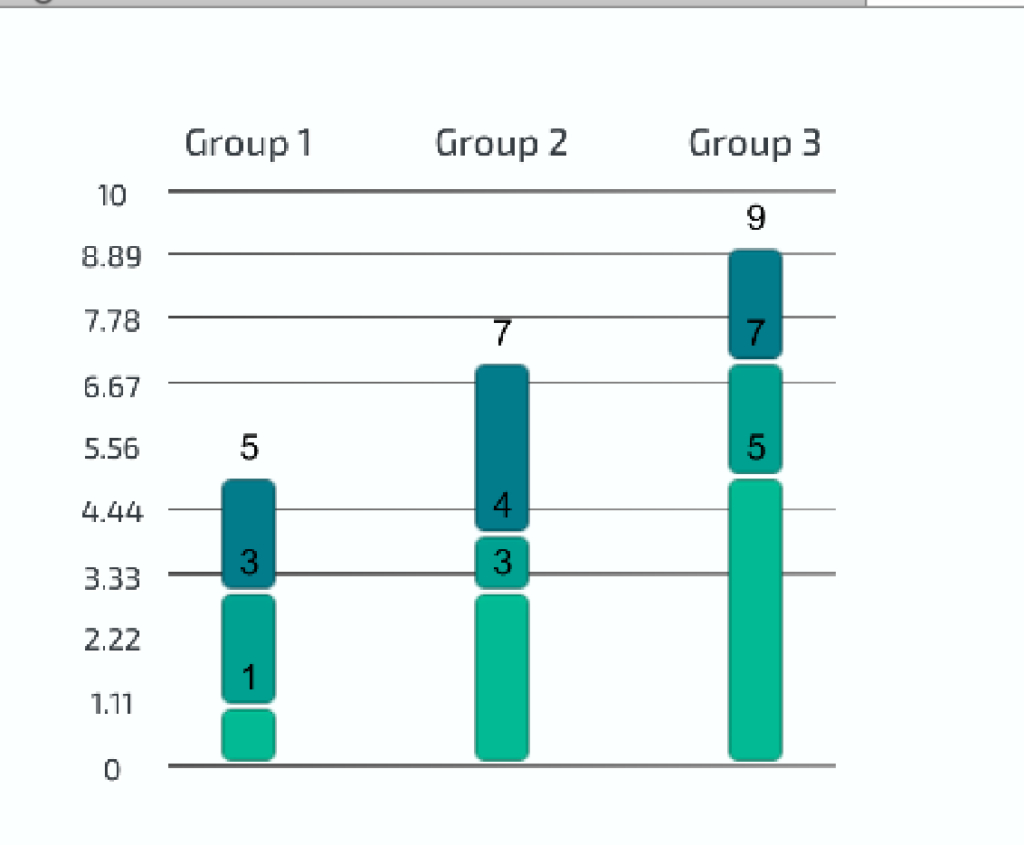
The key feature of it is that the bars are stacked one on top of the other. When using the staked view , you may get the following warning :

This means that bar values are not entered correctly. Notice that in a stacked bar , it is essential that each category has larger value then the previous category for each group. The example above is created using the following values for example:

Notice that each column is sorted in an ascending order . the row order does not matter. This is also important when feeding the bar chart data from script:
bar.DataSource.SetValue("Category 1","Group 1", 1.0);
bar.DataSource.SetValue("Category 2","Group 1", 3.0);
bar.DataSource.SetValue("Category 3","Group 1", 7.0);