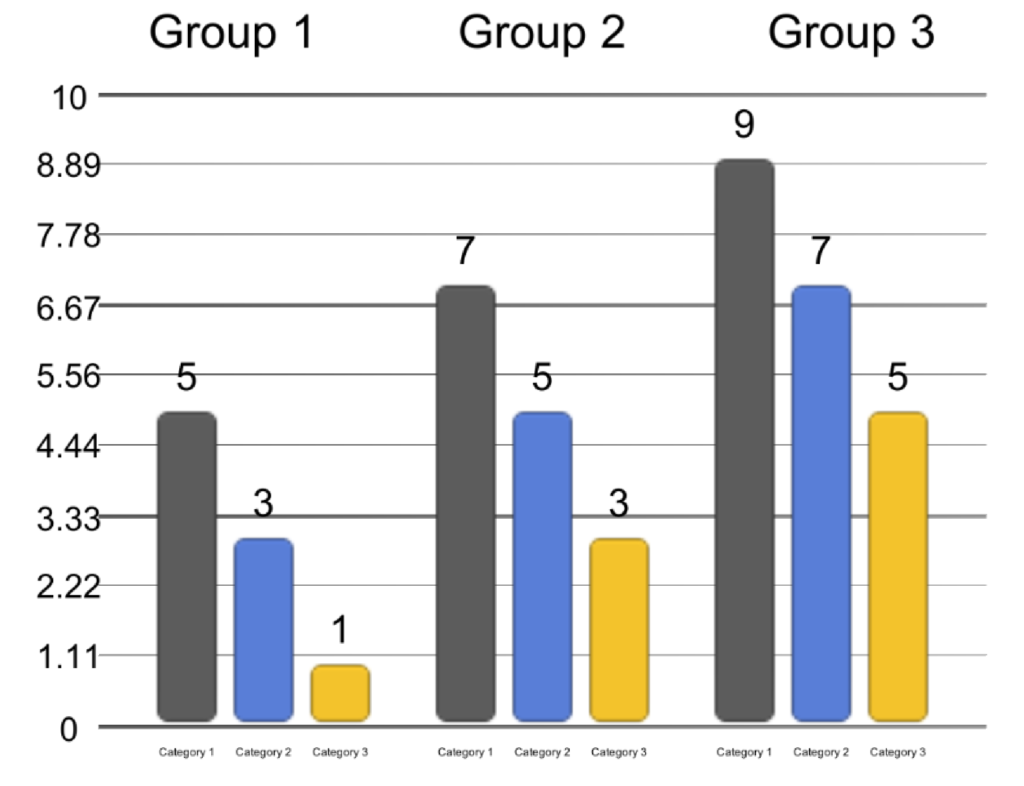
The bar chart allows you to draw bar plots. It allows you to also stack the bar on top of each other. You can customize the bars and use your own bar prefabs. The bar chart can be used with the HoriztonalAxis component. It can also be used with ItemLabels ,CategoryLabels and GroupLabels components.
The categories of the bar chart can be customized with color , and can then grouped , allowing you to easily create bar charts such as this :

Make sure to view the quick start tutorial : Bar Chart