This article describes the methods that manipulate data on the bar chart. You can also have a look at the Bar Chart Quick Start Tutorial
How to quickly set the bar chart data using the inspector
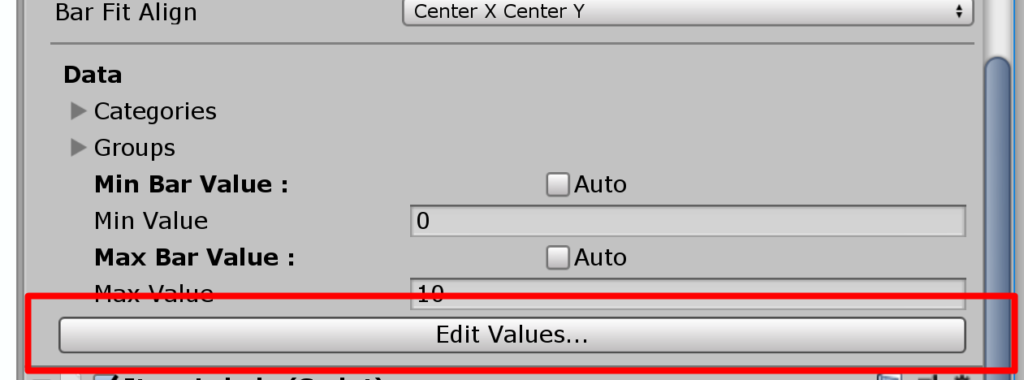
When creating a bar chart. You can quickly set it’s values in the inspector by click “Edit Values” in the data section of the bar chart component:
Once you click on it , you will see the edit values window :
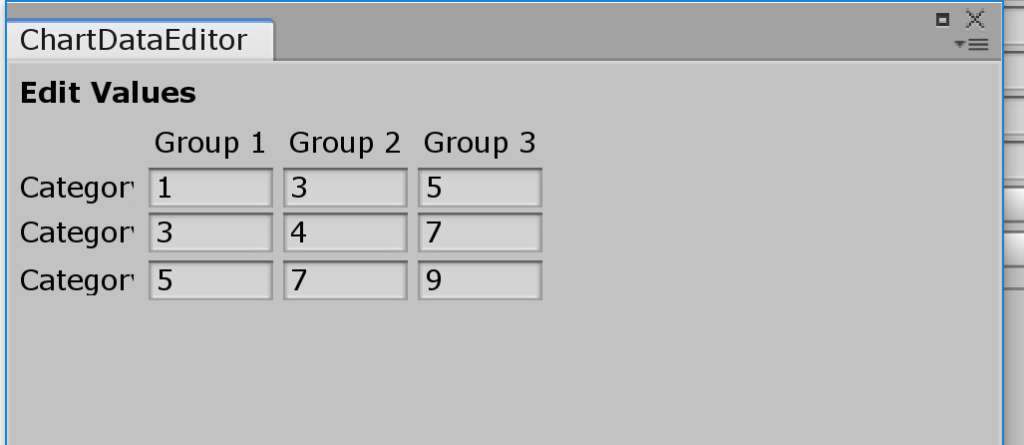
Each cell corresponds to a category and group. Any value change will immediately reflect in the scene view
Clearing the bar values
Some times we would like to clear all the bar values , this is useful when repopulating the chart with data for example. You can do it with the following method:
bar.DataSource.ClearValues(); // sets all the values to 0.0
double initialValue = 1.0;
bar.DataSource.ClearValues(initialValue); // sets all the value to initialValue
How to Set the Data of the bar chart
You can set the values of the bar chart by calling either SetValue or SlideValue.
- SetValue sets the value of a bar immediately
- SlideValue animates the value of the bar from it’s current value to the specified value
double barValue = 5.0;
bar.DataSource.SetValue("categoryName", "groupName", barValue);

float animationTime= 1.0; // one second;
bar.DataSource.SlideValue("categoryName", "groupName", barValue ,animationTime);

// you can also specify an easing curve for the animation :

public AnimationCurve curve; // can be set from inspector
bar.DataSource.SlideValue("categoryName", "groupName", barValue ,animationTime,AnimationCurve);
Use Case Example
Let’s say you have an sql data table and would like to apply it to the bar chart . Here is a possible way you go about it:
        SqlDataReader reader = command.ExecuteReader();
        var barChart = GetComponent<BarChart>();
        barChart.ClearGroups();
        int groupCount = 0;
        while (reader.Read())
        {
            groupCount++;
            String groupName = "Row " + groupCount;
            barChart.DataSource.AddGroup(groupName);
            double cat1 = reader.GetDouble(0);
            double cat2 = reader.GetDouble(1);
            double cat3 = reader.GetDouble(1);
            barChart.DataSource.SetValue("category 1",groupName,cat1);
            barChart.DataSource.SetValue("category 2",groupName,cat2);
            barChart.DataSource.SetValue("category 3",groupName,cat3);
        }
As you can see we are making using use ADO .NET in order to bring data from an sql table. We create a group for each table row, and then we add the values for each category in this row.