You can add axis to a chart by adding an axis component to the charts gameobject :

The available axis type are Vertical Axis and Horizontal Axis , Notice that some charts would not make since with some axis , for example the pie chart. So the axis can only be added to a chart that supports axis.
Once the axis is added , you will see them on the chart immediately :
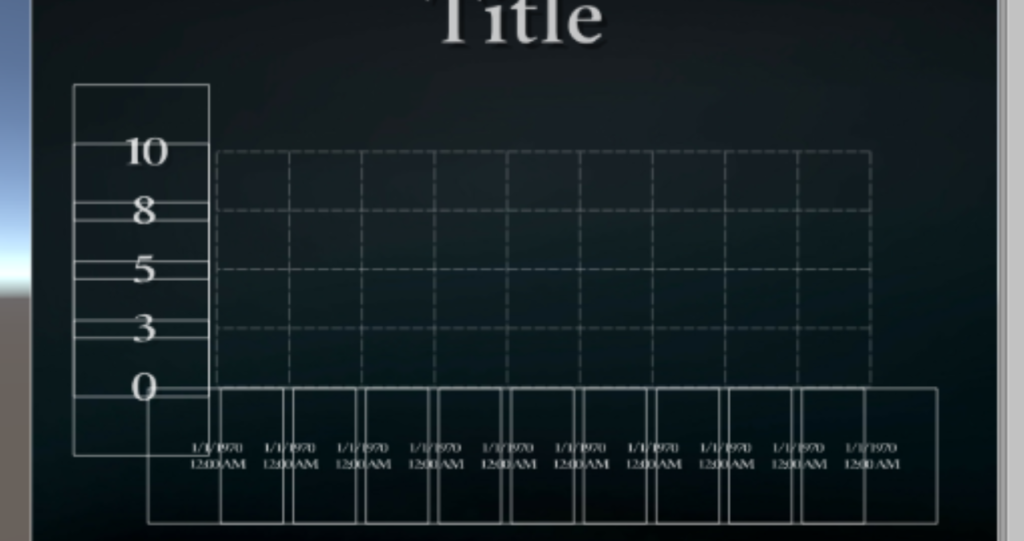
The lines that make the axis are called divisions in Graph and Chart. Axis can be used with main division and sub divisions , so you can create neat axis designs like this :
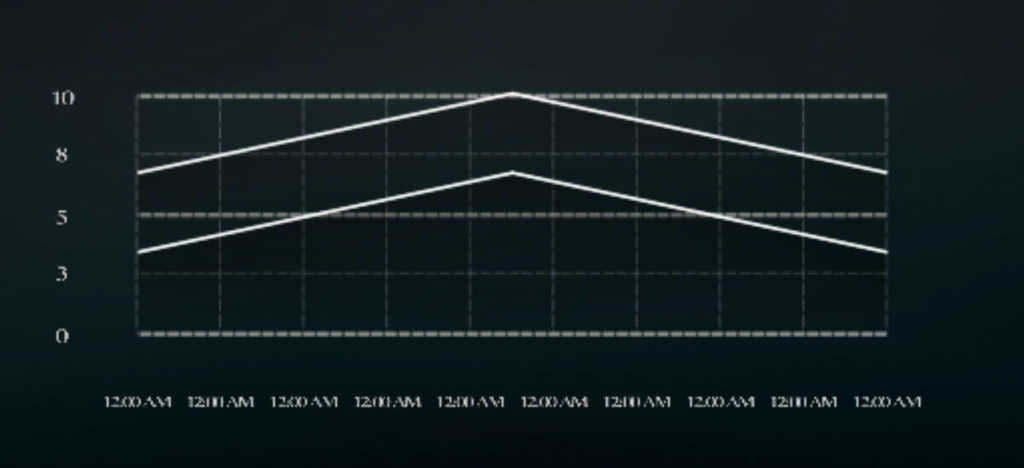
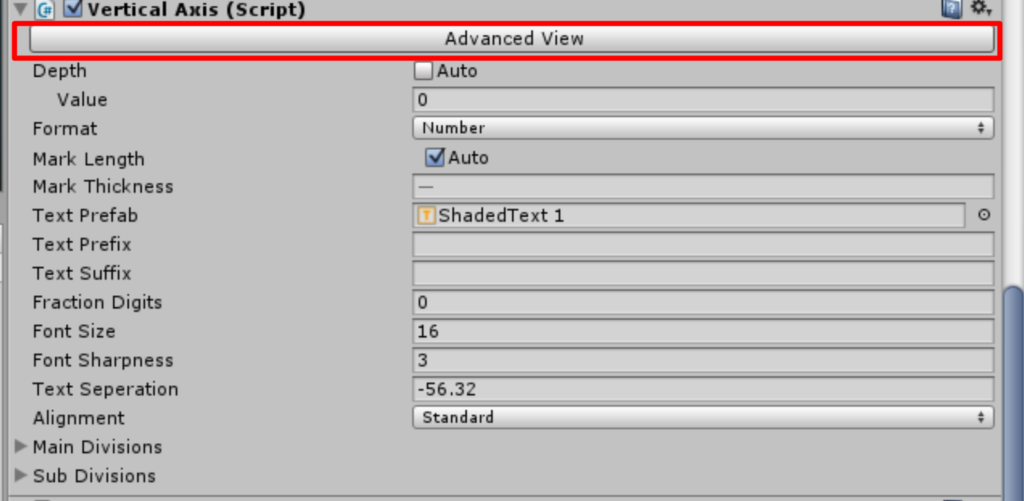
You can use simple view if you do not wish to have different style for each type of division , or to click on advanced view if you want full control of the design :
Setting up Main divisions
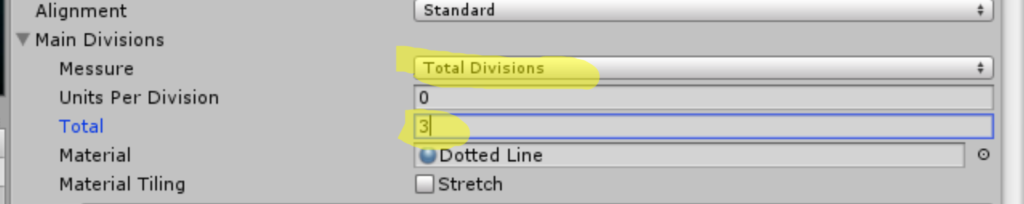
There are two options to setting up main divisions. You can set them so they have a fixed data unit , or as the amount of total division.
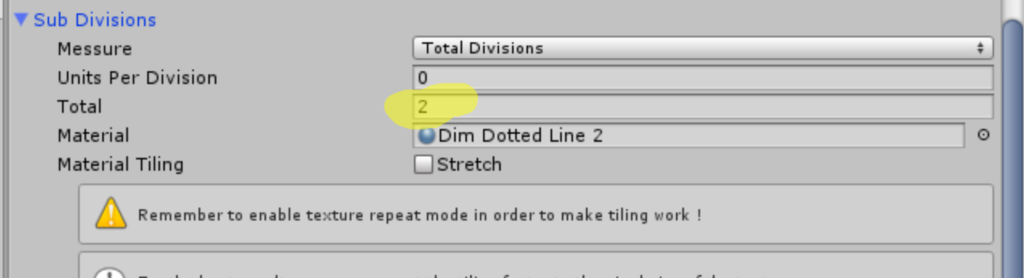
Example: If you would like to have exactly 3 main divisions , you can set Total to 3 and Messure to Total Divisions
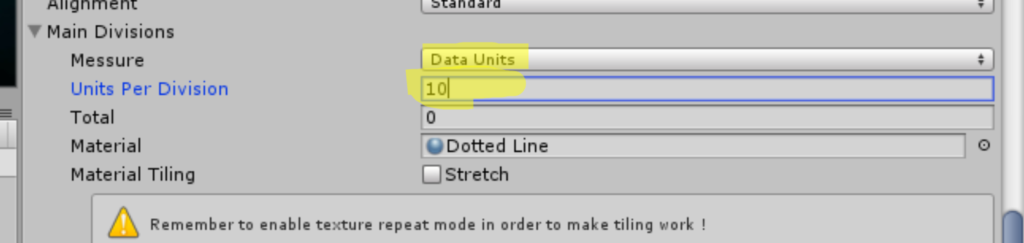
Example 2: if you would like to have a main division each 10 units , you can set Units Per Division to 10 and select Data Units
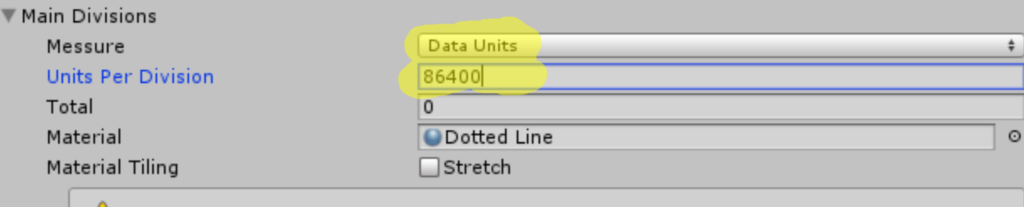
Example 3: lets say we are using date format for our chart and we would like to have a main division each 1 day. Then you can write the number of seconds in a day
Setting up Sub divisions
sub divisions are created for each main division. So if we have 2 main divisions and 3 sub divisions we have a total of 6 divisions. You can also set them to 0 and have only main divisions. setting up sub divisions can be done like so :
Setting up Text Labels
The text labels can be of dates, times and numbers . you can choose between them by setting the format property of the axis:
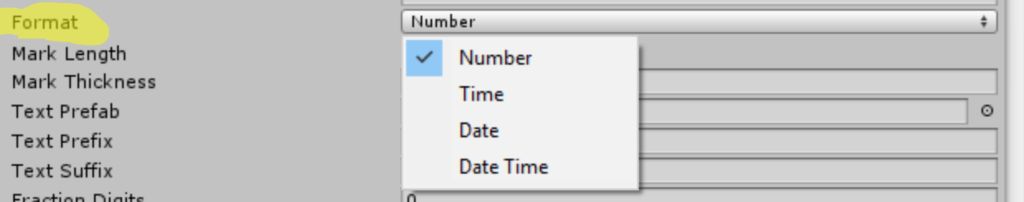
both main and sub divisions can have text label showing the value their positioned in. You can configure these text labels in the inspector:
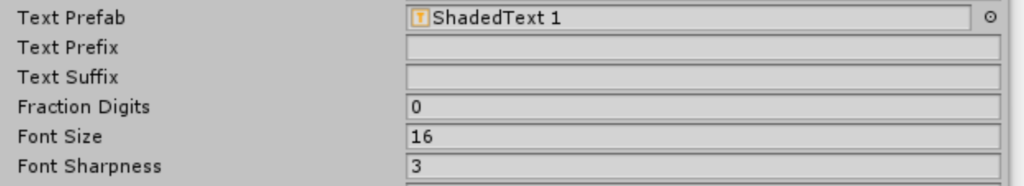
Also notice that you can add a text prefix or suffix. This can be used to make the values more understandable to the end user. For example you can set the Suffix to “USD” , “$” ,”Km\H” etc.
Changing axis from code
The axis component can be fully configured from code . See Obtaining a chart object for scripting to lean how to access the axis object from code. Then you can change all the Axis Settings