This article covers all the settings of the axis components. it is recommended to read Axis – Quick Start before reading this article.

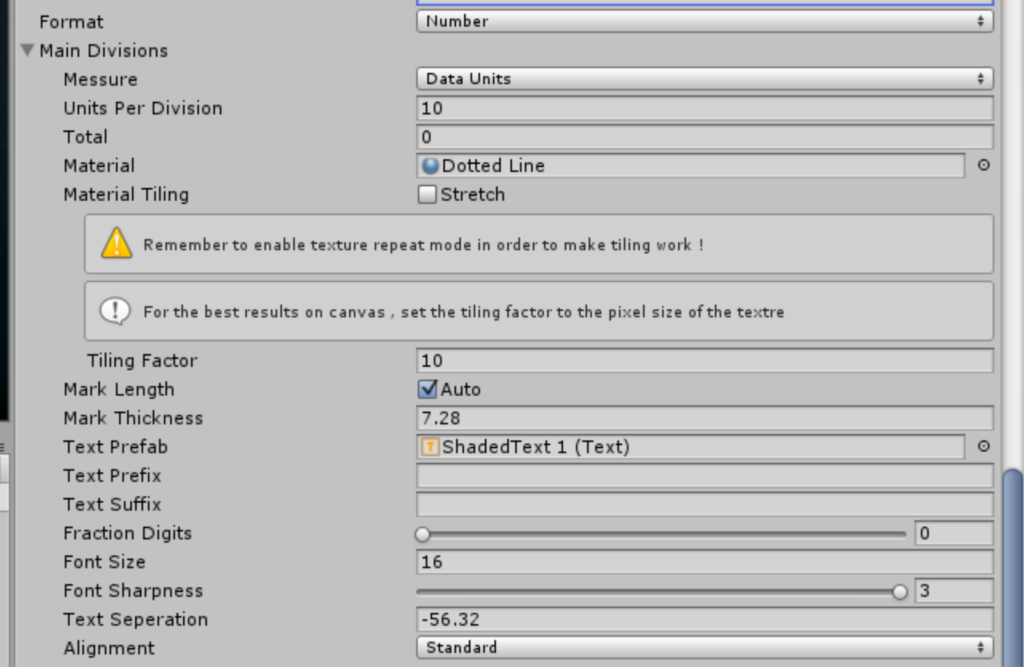
- Format select between date,date time , time and number. the selection will affect to format of the item labels of the chart. see Date, Time and Format
- Measure is the measure by which divisions are created. Total divisions divides the axis into an exact amount of divisions, Data Units Allows you to specify a unit amount for each division. See Axis – Quick Start for more information about measures.
- Units Per Division/Total are the parameter used for the Measure method specified See Axis – Quick Start for more information about measures.
- Material is the material used for line drawing
- Material Tiling defines how the material is tiled along the axis line. You can use material tiling to create effects such as dotted lines , or line patterns. See How to use material tilling
- Mark Length sets the length of the axis lines. The default is that the line is drawn across all the chart. If you wish to specify another length , disable the Auto check box
- Mark Thickness sets the thickness the axis lines.
- Text Prefab sets the prefab used for creating the axis labels. If no prefab is set , the default one is used. The text prefabs are located in Prefabs/Text
- Text Prefix/Suffix sets a prefix and a suffix for the text displayed in the labels. This is useful when you want to help the user make sense of the axis data. You can for example set it to “USD” ,”$”, “KM/H” .
- Fraction Digits sets the amount of allowed fraction digits for numbers in the chart. all values are rounded to fit into this number. If you want to display integers only you can set it to 0
- Font Size is the font size of the text labels
- Font Sharpness tweaks the sharpness of the font of the item label.
- Text Separation is the distance of the axis labels from their base position. The higher this value , the further the labels are for the axis.
- Alignment sets the base position of the label.
All of the these properties can be changed from script as well. see Obtaining a chart object for scripting