This article describes the methods that manipulate data on the pie chart. You can also have a look at the Pie Chart Quick Start Tutorial
How Is the pie data INTERPRETED
Each pie category is assigned with a value. This value is essentially the weight of that category relative to the other ones.
Mathematically speaking , all the pie values are summed together. Each pie item’s angle is determined by the value of its category relative to the sum of all categories. For example if we set all the categories to the value of 1 , they will be of equal size. We will get the following pie chart:

Now if we set the value to 1,2,3 we will get the following pie chart :

Now let’s have a look at the above image and understand it. The sum of all categories is 1+2+3 = 6.
- The first category has the value of 1. So it takes 1/6 from the entire pie chart
- The second category has the value of 2 . So it takes 2/6 from the entire pie chart
- The third category has the value of 3. So it takes 3/6 from the entire pie chart
It can be easy to just set the pie values to their percentage of the whole chart. In this case it is important to make sure they sum up to 100. For example we can set the categories to 10,40,50 :

As you can see in the image, each category matches the percentage we have specified for it .
HOW TO QUICKLY SET THE Pie CHART DATA USING THE INSPECTOR
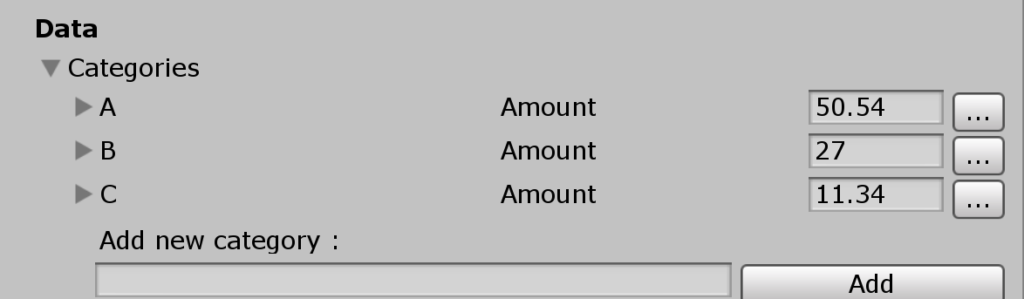
Each category in the inspector has a field that you can use to specify it’s value:
HOW TO Set the Data of the pie Chart
You can set the data of the pie chart by calling either SetValue or SlideValue.
- SetValue sets the value of a pie item immediately
- SlideValue animates the value of the pie item from it’s current value to the specified value
var pie = GetComponent<PieChart>();
double pieValue = 5.0;
pie.DataSource.SetValue(“categoryName”, pieValue );
float animationTime= 1.0; // one second;
pie.DataSource.SlideValue(“categoryName”, pieValue ,animationTime);
// you can also specify an easing curve for the animation :
public AnimationCurve curve; // can be set from inspector
pie.DataSource.SlideValue(“categoryName”, pieValue ,animationTime,AnimationCurve);
USE CASE EXAMPLE
Let’s say we have an sql query with a row we would like to load into the pie chart. The following example assumes you know how to configure categories from script. In this example ,we have an array of ready materials that will be assigned to the pie categories. Let’s have a look :
public Material[] materials; // this can be set in a monobehvouir

...

SqlDataReader reader = command.ExecuteReader();
var pieChart = GetComponent<PieChart>();
// clear the pie chart first
pieChart.Clear();
// add the columns from the data table as pie categories
for(int i=0;i<reader.FieldCount;i++)
{
  // make sure we are within bounds of the material array
  int categoryMaterial = Math.min(i,materials.Length -1);
  // add the category to the pie chart
  pieChart.DataSource.AddCategory(reader.GetName(i),materials[categoryMaterial]);
}
// now it is time to load the row data
if (reader.Read()) // we read only the first line
{
// for the first row , go through all the columns
  for(int i=0;i<reader.FieldCount;i++)
  {
   // get the column value
   double val = reader.GetDouble(i);
   // apply it to the pie chart
   pieChart.DataSource.SetValue(reader.GetName(i),val );
  }
}
reader.Close(); // close the reader
As you can see we are making using use ADO .NET in order to bring data from an sql table. At first we dynamically create a category for each column. We then read the first row of the table using reader.Read , and apply each value to the corresponding category. After reading the first row we have no more use for the reader , so we are calling reader.Close.