scroll down for the written tutorial
The resulting scene and script from this tutorial can be found at Assets\Chart and Graph\Demos\Tutorials\Pie
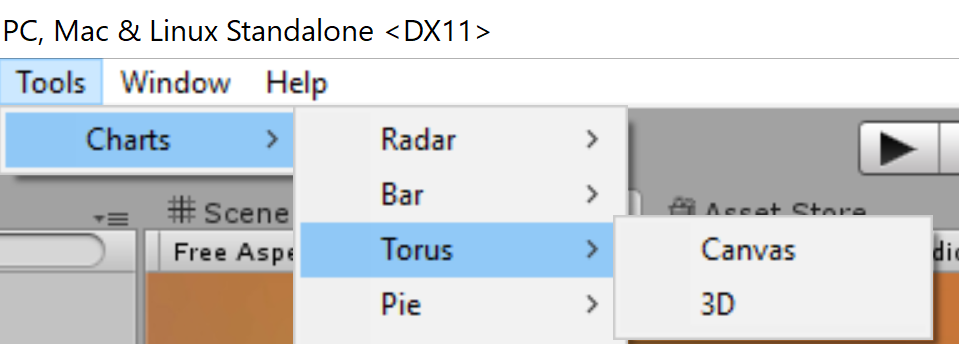
Go to Tools->Charts->Pie Or Tools->Charts->Torus and select the type of chart you would like to create. A new chart object should appear in the scene ( if a canvas chart is selected it should appear under a canvas).
Select the pie or torus object and view it in the inspector. Notice the data section of the chart inspector.
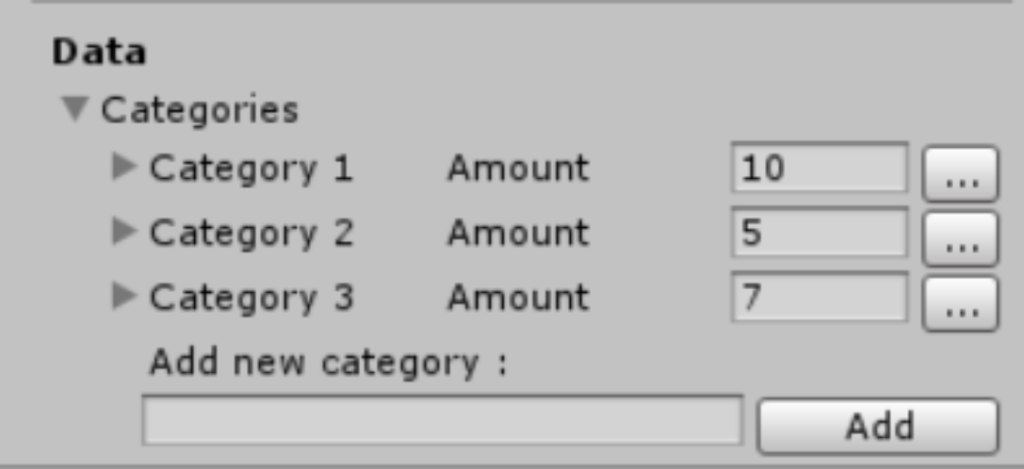
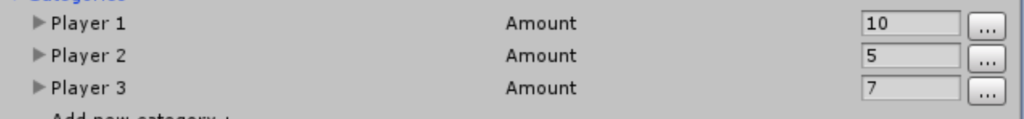
Expand the Categories foldout. You can add categories by typing a name and clicking the add button. You can remove and rename categories by clicking the “…” button near each one. For the sake of demonstration , We will assume that “category *” is renamed to “player *”. the data section of your inspector should now look like this :
You can change the amount of each pie slice by editing it’s input box. To update the pie chart from your script , create a new monobehaviour named PieChartFeed and add the following code to it :
void Start ()
 {
        PieChart pie = GetComponent<PieChart>();
        if(pie != null)
        {
            pie.DataSource.SlideValue("Player 1", 50, 10f);
            pie.DataSource.SetValue("Player 2", Random.value * 10);
        }
}
NOTICE: calling set value must be done with your own category names. Notice spaces and case letters
Add a PieFeedChart component to the pie chart object and click play.