The radar chart allows you to draw polygon based charts where each value is associated with a polygon edge. The radar chart cannot be used with HorizontalBarChart and VerticalBarChart, It has it’s own axis system. The radar chart can be used with the ItemLabels ,CategoryLabels and GroupLabels components.
The groups of the radar chart are the polygon edges of the axis , The categories are the colored polygons on top of the axis. You can look at the following image for reference:
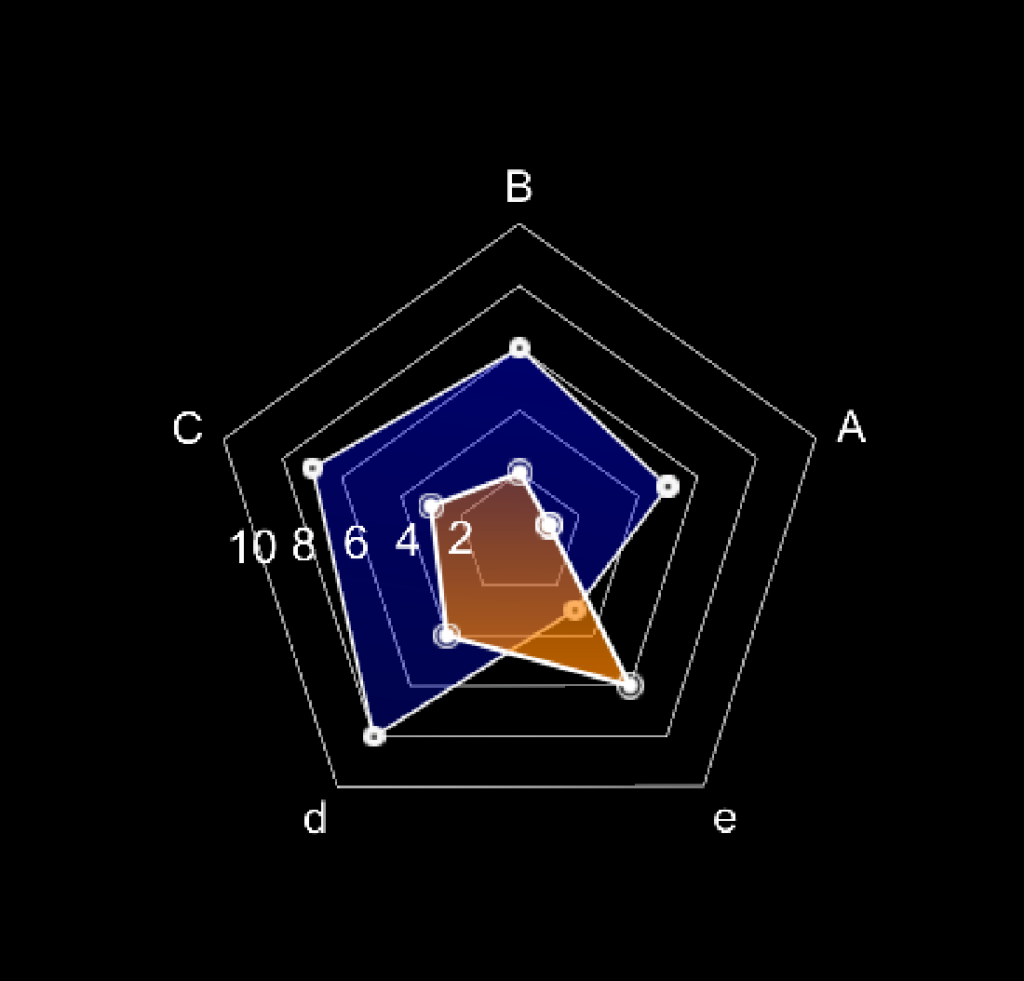
A,B,C,d,e are the groups of the radar chart. The blue and orange polygons are the categories.
Make sure to view the Radar Chart Quick Start Tutorial