scroll down for the written tutorial
The resulting scene and script from this tutorial can be found at Assets\Chart and Graph\Demos\Tutorials\Bar
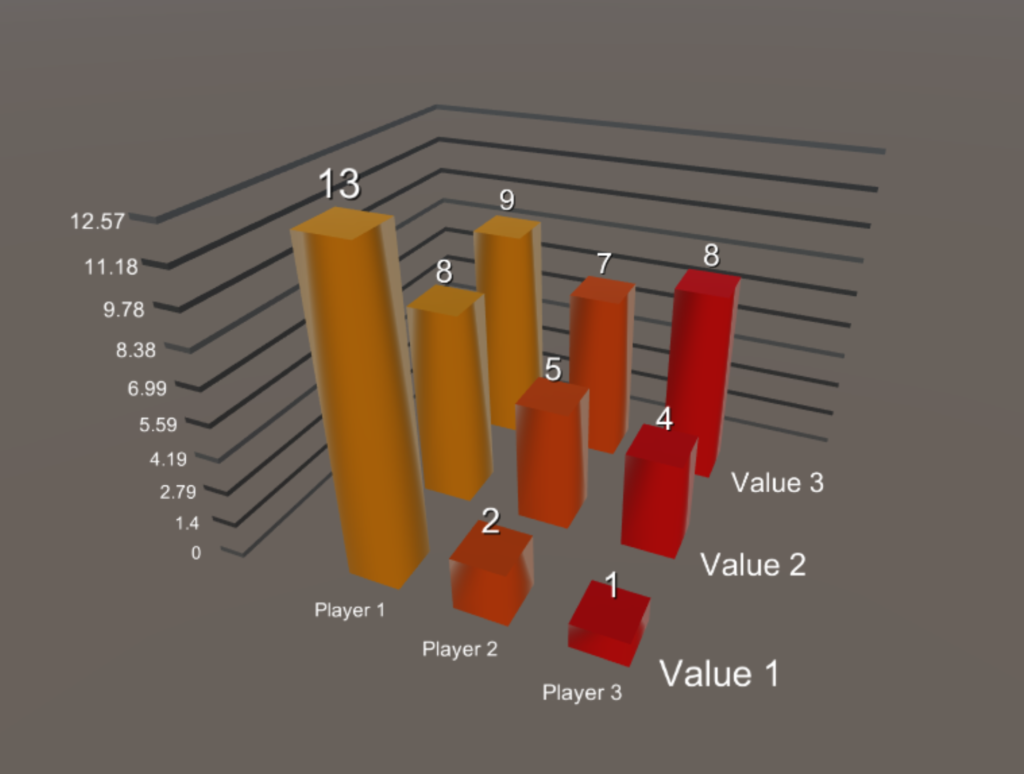
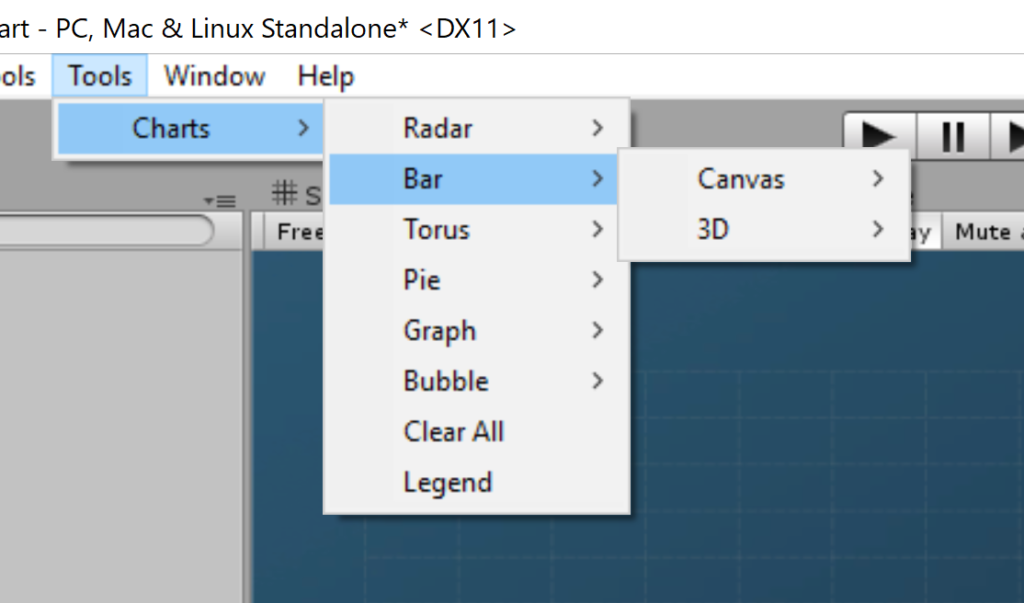
Go to Tools->Charts->Bar and select the type of bar chart you would like to create. A new chart object should appear in the scene ( if a canvas chart is selected it should appear under a canvas).
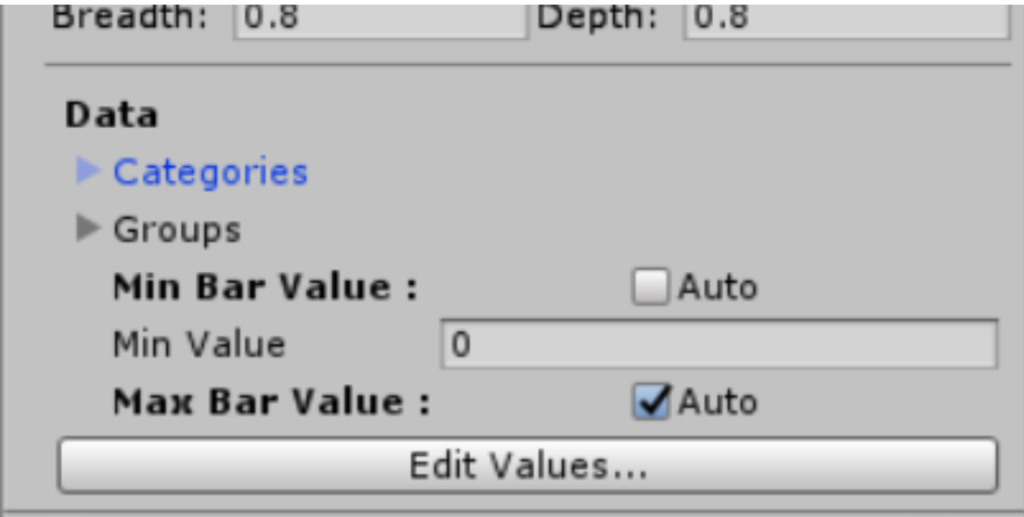
Select the bar object and view it in the inspector. Notice the data section of the bar chart inspector.
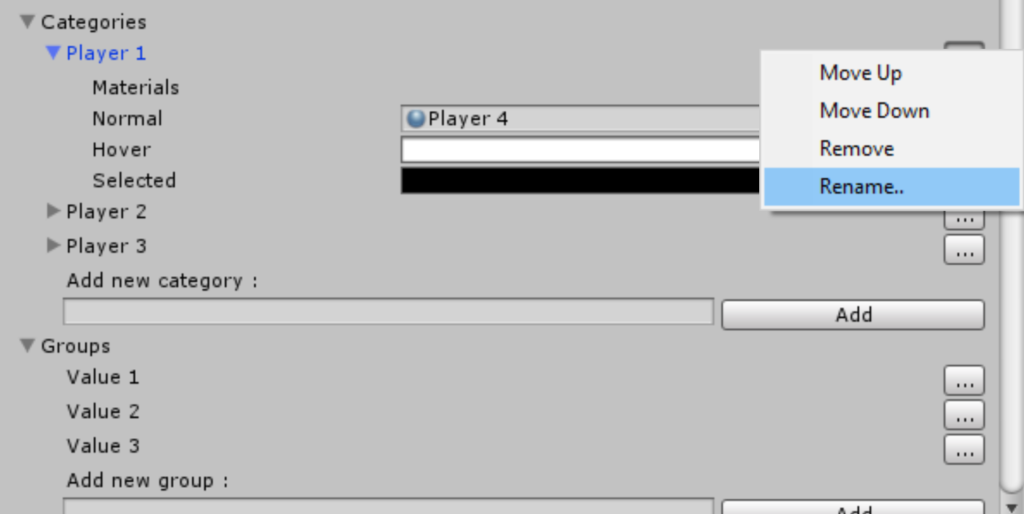
Expand both Categories and groups. You can add groups and categories by typing a name and clicking the add button. You can remove and rename groups and categories by clicking the “…” button near each one. For the sake of demonstration , We will assume that “category *” is renamed to “player *” and “group *” is renamed to “value *” . After creating the categories the data section should look like this :
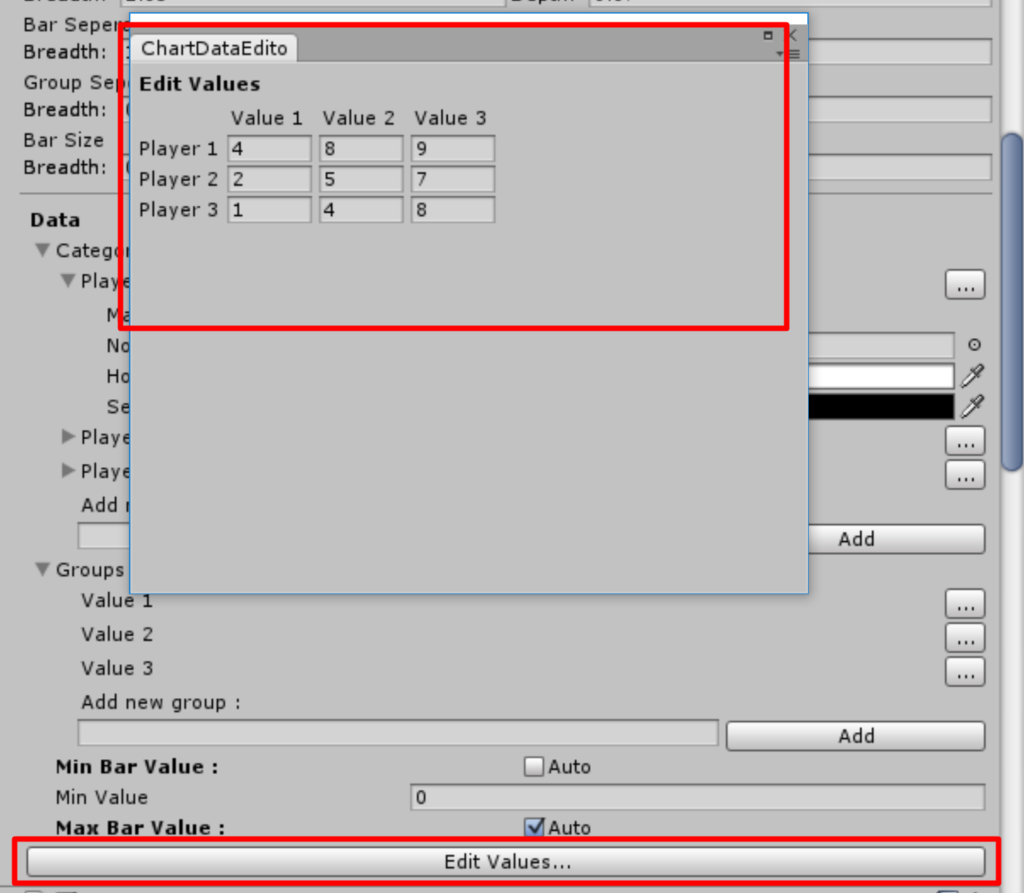
To edit the chart values from the editor click the “Edit Values” button
To update the bar chart from your script , create a new monobehaviour named BarChartFeed and add the following code to your script :
void Start () {
        BarChart barChart = GetComponent<BarChart>();
        if (barChart != null)
        {
            barChart.DataSource.SetValue("Player 1", "Value 1", Random.value * 20);
            barChart.DataSource.SlideValue("Player 2","Value 1", Random.value * 20, 40f);
        }
    }
NOTICE: calling SetValue and SlideValue must be done with your own group and category names. Notice spaces and case letters
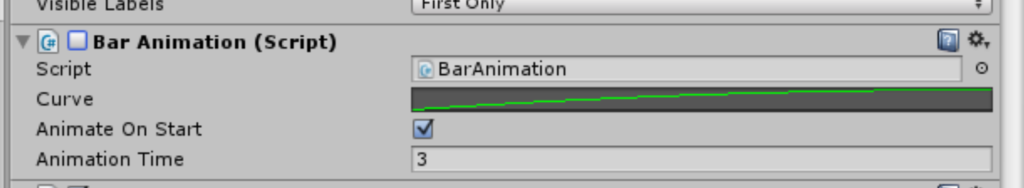
make sure there is no BarAnimation component attached to the bar chart.
Add a BarFeedChart component to the bar chart object and click play