There are many ways to display numbers and dates. Graph and Chart has a built in formatting system that allows you to format text labels in a very flexible way. In this article you will learn how to make the most out of formats in Graph and Chart.
Chossing between a date and a number for an axis
In the view portion tab of the chart inspector. You can specify whether an axis is a date or a number. The type is determined by the type of the View origin. As you can in this image:

Setting up the default formats
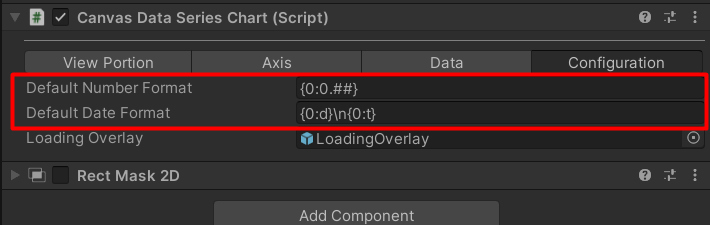
if you click the ‘Configuration’ Tab in the chart inspector you will find the following formats:
These are standard C# string formats, and are formatted using String.Format . you can learn more about them here and here
If we take a look at the image above :
- Default Number format is set to “{0:0.##}” – means all numbers in the chart will be format with a maximum of 2 fraction digits. (for example 22.35)
- Default Date Format is set to “{0:d}\n{0:t}” – means it will show a localized date string, and a localized time string in a new row.
Setting the format of the Axis labels
The format of the axis labels can be set using the <?size> variable.
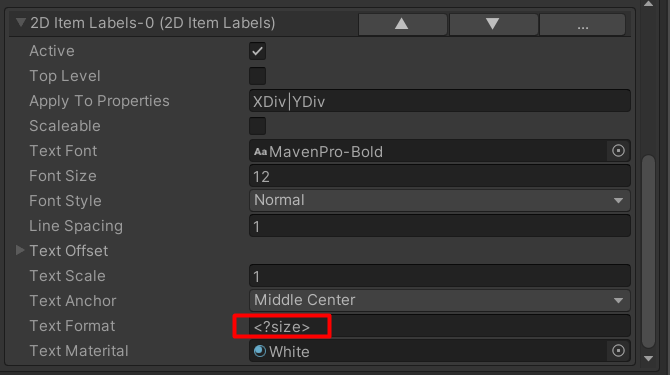
The <?size> variable can be used with constants. Here are some examples:
- “<?size>$” – shows the number with a dollar sign after it ( for example “5$”,”6$”)
- “Log(<?size>)” – shows the number inside a log . (for example “Log(5)”,”Log(10)”)
- “<?size> cm” – shows a number of centimeters (for example “5 cm” , “6 cm”)
- “<?size>” – when the axis is in date mode , this will show the date according to the default format
SETTING THE FORMAT OF Point LABELS
In a similar way to axis labels, point labels are specified using the variables <?x> and <?y>

Here are some examples of text formats:
- “<?y>” – shows only the y value of a point
- “(<?x>,<?y>)” – shows a coordinate (for example “(5,6)” ,”(7,8)”
- “<?y> cm, in<?x>” – when the x axis is in date mode it will show “5 cm, in 5/4/21”
Overriding the default format
In all of the examples above, you can override the default format and use a custom one. you can do that by modifying the variable like so :
For numbers , you can set the override according to this
- “<?size:0.00>” – overrides the default format and always shows two fraction digits
- “<?y:0.#>” – overrides the default format and shows one optional fraction digit
For dates you can set the override according to this
- <?dateTime-size:hh-mm-ss> – show the time only (for example 12:34:02)
- <?dateTime-x:MMM-YYYY> – show the month and year (for example Dec 2016)