Join Now
  • Home
  • Products
    • Graph And Chart
  • About Us
BitSplash IO

Basic Concepts

  • *** VERY IMPORTANT NOTICE ***
  • Tutorial: Quick start
  • Tutorial: Complete chart setup
    • Step 1: Creating a chart GameObject
    • Step 2: Configuring a new category
    • Step 3: Configuring the axis
    • Step 4: Configuring the axis labels
    • Step 5: Filling the chart with Data
    • Step 6: Adding an interaction to the chart
  • Setting the view portion
  • Setting up the categories of the chart
    • Adding a new category
    • Deleting a category
    • Renaming a category
  • Setting up the visual features of a category
    • Adding a new visual feature
    • Reordering visual features
    • Renaming a visual feature
    • Deleting a visual feature
  • Setting up the visual features of the axis
  • Loading data into a category
  • Number formats and date formats
  1. Home
  2. Docs
  3. Basic Concepts
  4. Tutorial: Complete chart setup
  5. Step 1: Creating a chart GameObject

Step 1: Creating a chart GameObject

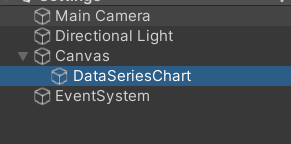
Create a UI canvas and a new game object under it

set the GameObject’s name to ‘DataSeriesChart’


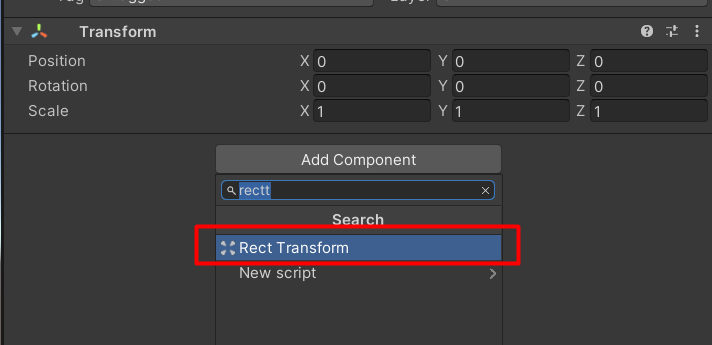
Add a RectTransform component to the gameobject

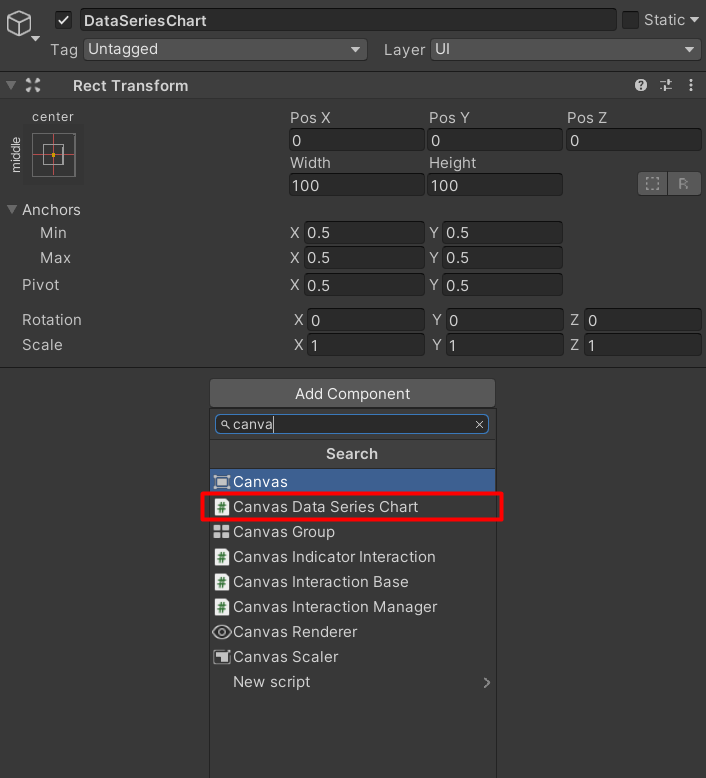
Add a ‘CanvasDataSeriesChart’ Component to the gameobject

Go to the chart inspector and add a ‘CanvasDataSeriesChart’ component to the GameObject


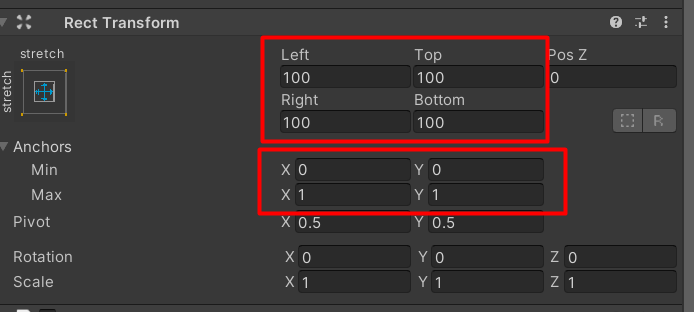
Configure the GameObject’s Transform

Next Step

Continue to the next step of this tutorial

Updated on December 8, 2021

Doc navigation

Step 2: Configuring a new category →
  • Home
  • Support
  • About Us
2019 © Copyrights BitSplash.