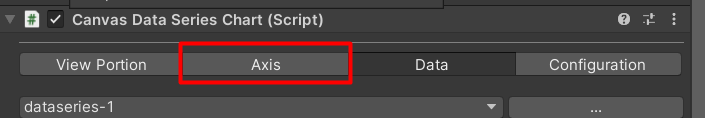
Go To the Axis tab of the chart inspector
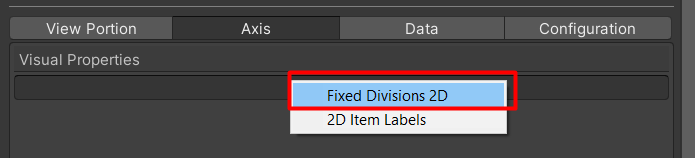
Click on ‘Add New’ and select ‘Fixed divisions 2d’
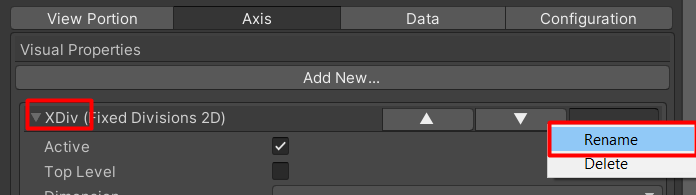
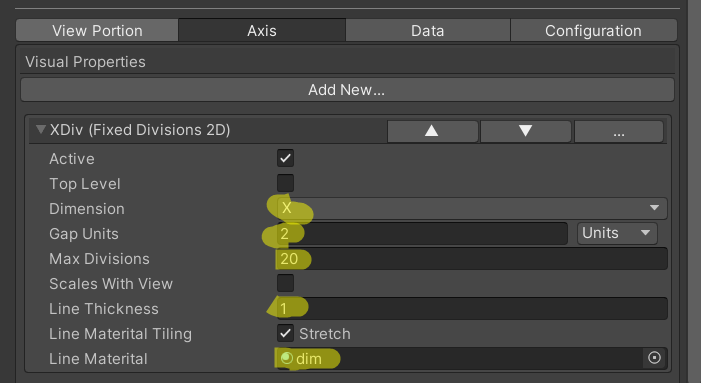
Rename the new visual feature to ‘XDIV’
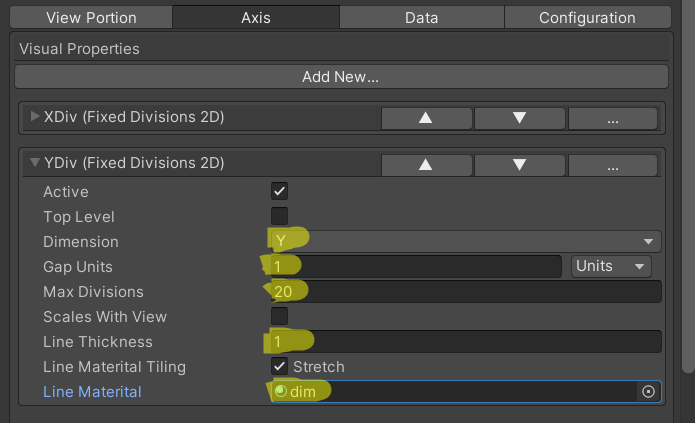
Configure the XDiv Component:
- Set the Dimension to ‘X’ – this makes the divisions run along the x axis
- Set the Gap Units to ‘2’ – this creates a division for every 2 units
- Set the Max Divisions to ’20’ – when zooming out if the amount of visible divisions is larger then 20 , some divisions will be dropped so there are less then 20 visible divisions
- Set the Line Thickness to ‘1’ – each division has a line thickness of 1
- Assign the Line Material – the material used for the divisions
Create a similar feature named ‘YDIV’ and configure it in a similar way