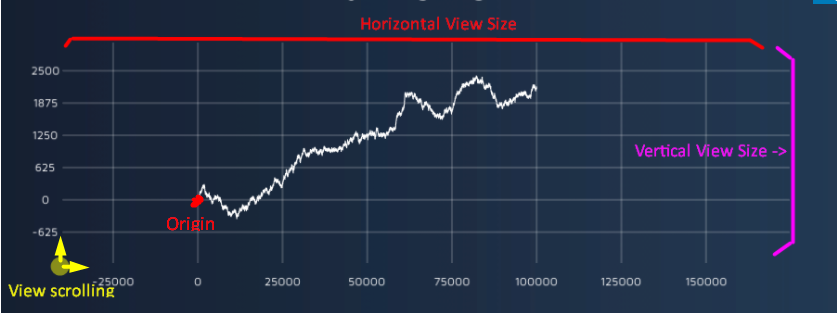
You can think of the view portion as a window into the data of the chart. When you apply a view portion to a chart , all the data that is not contained in it will not be shown. The view portion can be changed in real-time , per frame basis. In the following sections you will learn how to make the most of the view portion in Graph And Chart.
Setting the view portion from the inspector
Select the “View Portion” tab in the DataSeriesChart’s inspector
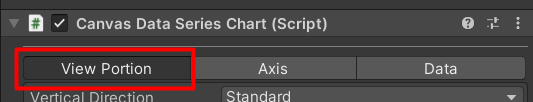
These are the settings of the view portion:

- Vertical Direction – sets the direction of the vertical axis. Setting it to “Standard” will make the y-axis span from bottom to top. Setting it to “Opposite” will make the y-axis span from top to bottom
- Horizontal Direction – sets the direction of the horizontal axis. Setting it to “Standard” will make the x-axis span from left to right. Setting it to “Opposite” will make the x-axis span from right to left
- Vertical/Horizontal Origin – The origin of the axis. This is a point of reference for the beginning of the axis. Scrolling is relative to the origin. You can choose to change the type of the origin to “Date” and specify a date as the beginning of the axis
- Vertical/Horizontal Scrolling – sets the offset of the view portion, use this to navigate the chart view. For example , setting horizontal to 3 and vertical to 4 , will make the view portion start from point (3,4).
- Vertical/Horizontal View size – sets the size of the view portion. For example , setting the horizontal view size to 10 , will have the view portion span over 10 units along the horizontal axis.
- Automatic Vertical/Horizontal View – when toggled , the origin and size of the view portion are determined by the horizontal/vertical bounds of the data in the chart.
- Auto Scroll Horizontally/Vertically – when toggled , the scrolling of the view portion is determined by the last data point in the chart. This can be useful for a continuous data stream application
- Vertical/Horizontal Panning – allows the user to pan using drag gesture with a mouse or touch pointer.
- Vertical/Horizontal Zooming – allows the user to zoom using the mouse wheel.
Setting the view portion from script (numbers)
public CanvasDataSeriesChart chart; // set this from a MonoBehaviour inspector
//***Setting The View Origin of the chart***
chart.AxisView.HorizontalViewOrigin = 0;
chart.AxisView.VerticalViewOrigin = 0;

//***Setting the scrolling of the chart***
chart.AxisView.HorizontalScrolling = 100;
chart.AxisView.VerticalScrolling = 100;

//***Setting the view size of the chart***
chart.AxisView.HorizontalViewSize = 100;
chart.AxisView.VerticalViewSize = 100;
setting the view portion From script (dates)
//***Switching between dateTime origin and number***
chart.AxisView.HorizontalIsDateTime = true/false;
chart.AxisView.VerticalIsDateTime = true/false;

//***setting the origin of the chart***
chart.AxisView.HorizontalViewOriginDateTime = DateTime.Now;
chart.AxisView.VerticalViewOriginDateTime = DateTime.Now;

//***setting the scrolling of the chart***
chart.AxisView.HorizontalScrollingTimeSpan = TimeSpan.FromDays(10); // scroll the view by 10 days
chart.AxisView.VerticalScrollingTimeSpan = TimeSpan.FromDays(10); // scroll the view by 10 days

//***setting the view size of the chart***
chart.AxisView.HorizontalViewSizeTimeSpan = TimeSpan.FromDays(10); // the view size is 10 days
chart.AxisView.VerticalViewSizeTimeSpan = TimeSpan.FromDays(10);
Example
You can find an example of setting the view portion from script in “Extras/Example Scenes/ViewPortionFromScript”