This article describes a method for filling an object using GraphDataFiller . Check out the full tutorial
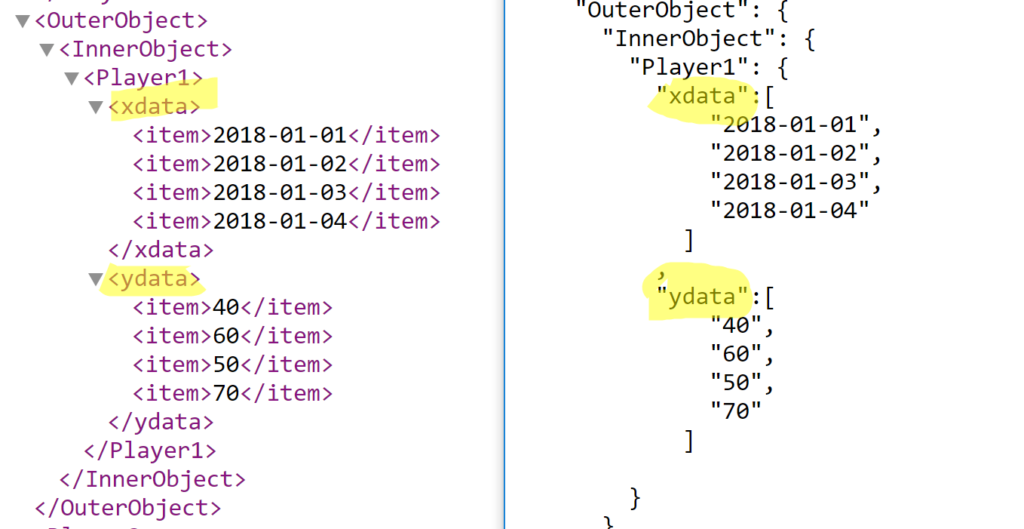
Consider the following XML/JSON setup. It has multiple arrays , each has data on one axis of the graph :

Also, in this case, we have the x axis with a date format.
You can use the following setting to parse this object:

Few things to notice about the above image:
- The selected Data Type is Array for each element. “Cat2” is the name of the new category in the graph chart.
- Notice the use of the “>” operator to select a deep object in the XML/JSON file. “OuterObject>InnerObject>Player1” corresponds to the sample scripts :


- X/Y Data Object Name is the name of the arrays containing the data. Look at the XML/JSON for reference:

- In X/Y Date Format , you can specify a date format for parsing, it corresponds to the specs here