scroll down for the written tutorial
The bubble chart is essentially a part of the graph chart , the graph chart enables you to control point sizes for all data points. Feeding a bubble chart is done by passing a point size parameter to any of these methods :
AddPointToCategory
AddPointToCategoryRealtime
AddCurveToCategory
AddLinearCurveToCategory
SetCurveInitialPoint
For example :
graph.DataSource.AddPointToCategory(“Player 1”, Random.value * 10f, Random.value * 10f, PointSize);
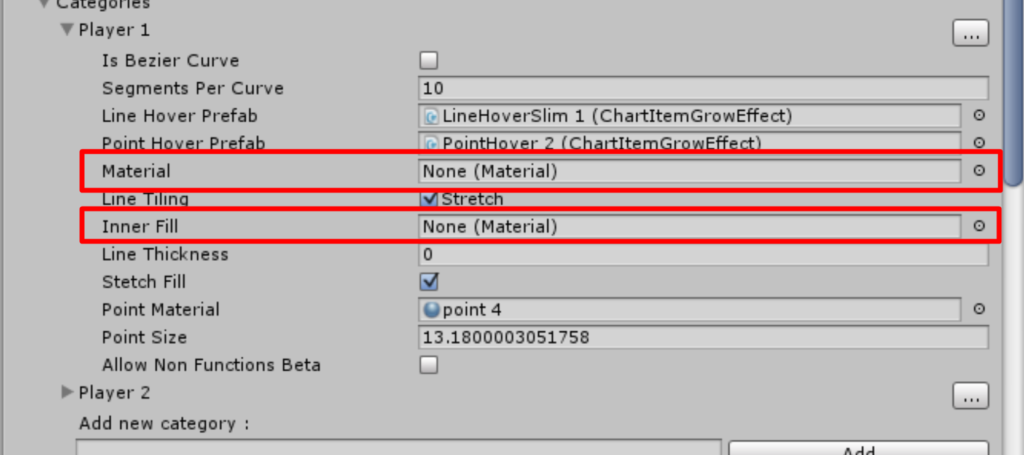
In order to make a complete bubble chart look , disable visual components such as line and fill for the category :
You can find an example of the Bubble chart in Assets\Chart and Graph\Themes\2d\Bubble